Narratives Are Powerful, But Check the Math
The first principle [of scientific inquiry] is that you must not fool yourself – and you are the easiest person to fool _ Richard Feynman
In God we trust; all others must bring data. _ attributed to W. Edwards Deming (ironically without any primary source backing up the attribution)
The Amy Cuddy TED talk was electrifying.
Video spoiler: If you adopt a “power pose” for 2 minutes, Amy Cuddy says it will not only change your posture, image, and attitude, but even your body chemistry, with more production of testosterone and anti-stress hormones.
It’s a great story, which is probably why it’s currently the second most-viewed TED talk.
Unfortunately, the published study study had only 42 participants. And other studies haven’t replicated the results on hormone production. Andrew Gelman even uses the opprobrious term p-hacking: data-mining to find a spectacular result.
The curse of dimensionality: the more things you measure, the more things will significantly deviate from the median.
The math can be counterintuitive.
Take a sample of apples. Grade each apple with a single number, like weight. For a contrived example, let’s say weight is uniformly distributed between 0 and 1.
What percentage of objects lie between 0.25 and 0.75 (the middle 50%?).
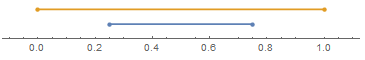
Obviously, the blue line is 50% of the orange line.
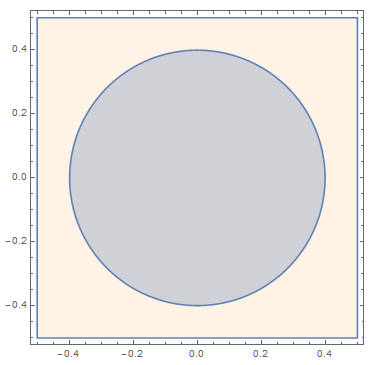
Let’s grade apples along 2 dimensions, e.g. weight and redness.
What percentage of objects lie in the middle along both dimensions? Assuming weight and redness are uncorrelated, the answer is 50% squared, i.e. 25%.
How big a circle do we have to select to get to 50% of objects? We have to solve
![\[ \Pi r^2 = 0.5 \]](/assets/wp-content/ql-cache/quicklatex.com-ca6bb157365d495c44813054d379bf2a_l3.png "Rendered by QuickLaTeX.com")
which gives r = 0.3989.
We see that we need a circle with almost 80% diameter to capture 50% of the square.
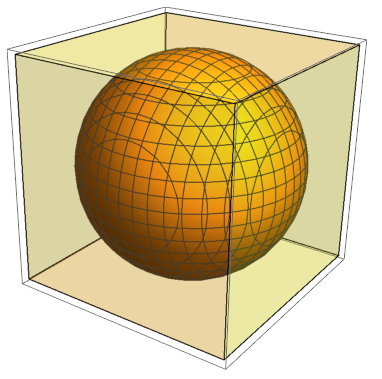
Let’s grade apples along 3 dimensions, e.g. weight, redness, and sweetness.
What range do we have to select to get to 50% of objects? We have to solve
![\[ \dfrac{4}{3} \Pi r^3 = 0.5 \]](/assets/wp-content/ql-cache/quicklatex.com-fe335cb539f421c3562de8a20a7973b2_l3.png "Rendered by QuickLaTeX.com")
which gives r = 0.492373.
We need a sphere with almost 100% diameter to capture 50% of the cube.
The point is, as you add more variables, the central 50% (or any x%) contains more and more extreme values. As you add dimensions, the outlying regions get bigger faster.
We can extend to higher dimensions which we can’t visualize, and chart the width of the 50% hypercube as we increase the dimension:
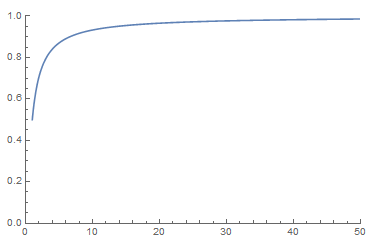
If you have 14 dimensions, the 50% hypercube is 95% of the length of the unit hypercube.
With enough features, anything or anybody is an outlier on some dimension.
Suppose you do an experiment measuring the variation of testosterone after assuming a power pose.
Suppose the power pose in fact has no effect on the level of testosterone (the ‘null hypothesis’).
If you observe a change due to chance variation, 95% of the time it will be statistically insignificant at the p > 0.05 level, and significant (p < 0.05) 5% of the time.
If testosterone and corticosteroids both exhibit no effect, the measured change in both will be statistically insignificant 0.95 * 0.95 = 90% of the time (assuming no correlation between them). As you measure more variables, the chance of one of them being significant goes up rapidly.
If you measure 14 insignificant variables, there’s a 50% chance one will be significant at the p < 0.05 level.
If you measure 50 insignificant variables, there’s a 92% chance one will be significant. 92% of that 50-dimensional ‘hypercube’ is in its outermost 5% region.
That’s how you get a prank paper to go viral showing chocolate helps people lose weight.
This sort of thing could be avoided if it was standard practice to hold back some test data, and do an out-of-sample test on any scientific finding. The methodology as practiced, to assume errors are unsystematic, and report p-values and significance on that basis, even on small samples tested for multiple relationships, seems weak and unscientific.
Returning to Amy Cuddy, you can interpret this a couple of different ways.
One interpretation: Statistics do not back up her story, that power poses raise hormone levels.
Another interpretation: Statistical methods are weak at finding complex stories, and you have to come up with a story to understand the world, and look for statistical confirmation where you can find it.
Acting with confidence and joy is contagious, to your own psyche and how others view you. That’s a story. Stories let humans understand and remember very complex phenomena.
For instance, attach a story related to their personal experience, and people solve tricky logic problems easily. Show them the same version as an abstract math problem, they fail miserably.
Feynman, quoted above about not fooling yourself, also said you must develop your intuition, thinking through examples and understanding the story of how things work as more than mathematical abstractions.
Stories are powerful. The more interesting things in the universe are complex interactions, like stories: evolution, the Big Bang, the French Revolution.
The curse of dimensionality means that as you absorb more features of the world, the possible states and explanations and oddities rise according to factorials and exponents. Things get curiouser and curiouser. There are complex interactions that can’t easily be explained. Stories are how humans make sense of a complex world.
Stories can mislead. A great story can be spurious, T. H. Huxley’s “great tragedy of science _ the slaying of a beautiful hypothesis by an ugly fact.”
Stories are a powerful shortcut (Kahneman’s ‘thinking fast.’). But they are a shortcut that can lead you astray, so you also need to stop from time to time and make sure you know where you are going (Kahneman’s ‘thinking slow’).
So use your evolution-given power to understand complexity through narrative — but check the math.
Even if poses don’t elevate hormone levels, Superman and Wonder Woman were depicted that way for a reason. Don’t slouch through life due to lack of statistical evidence you shouldn’t!