Projects
Safe Withdrawal Retirement Calculator
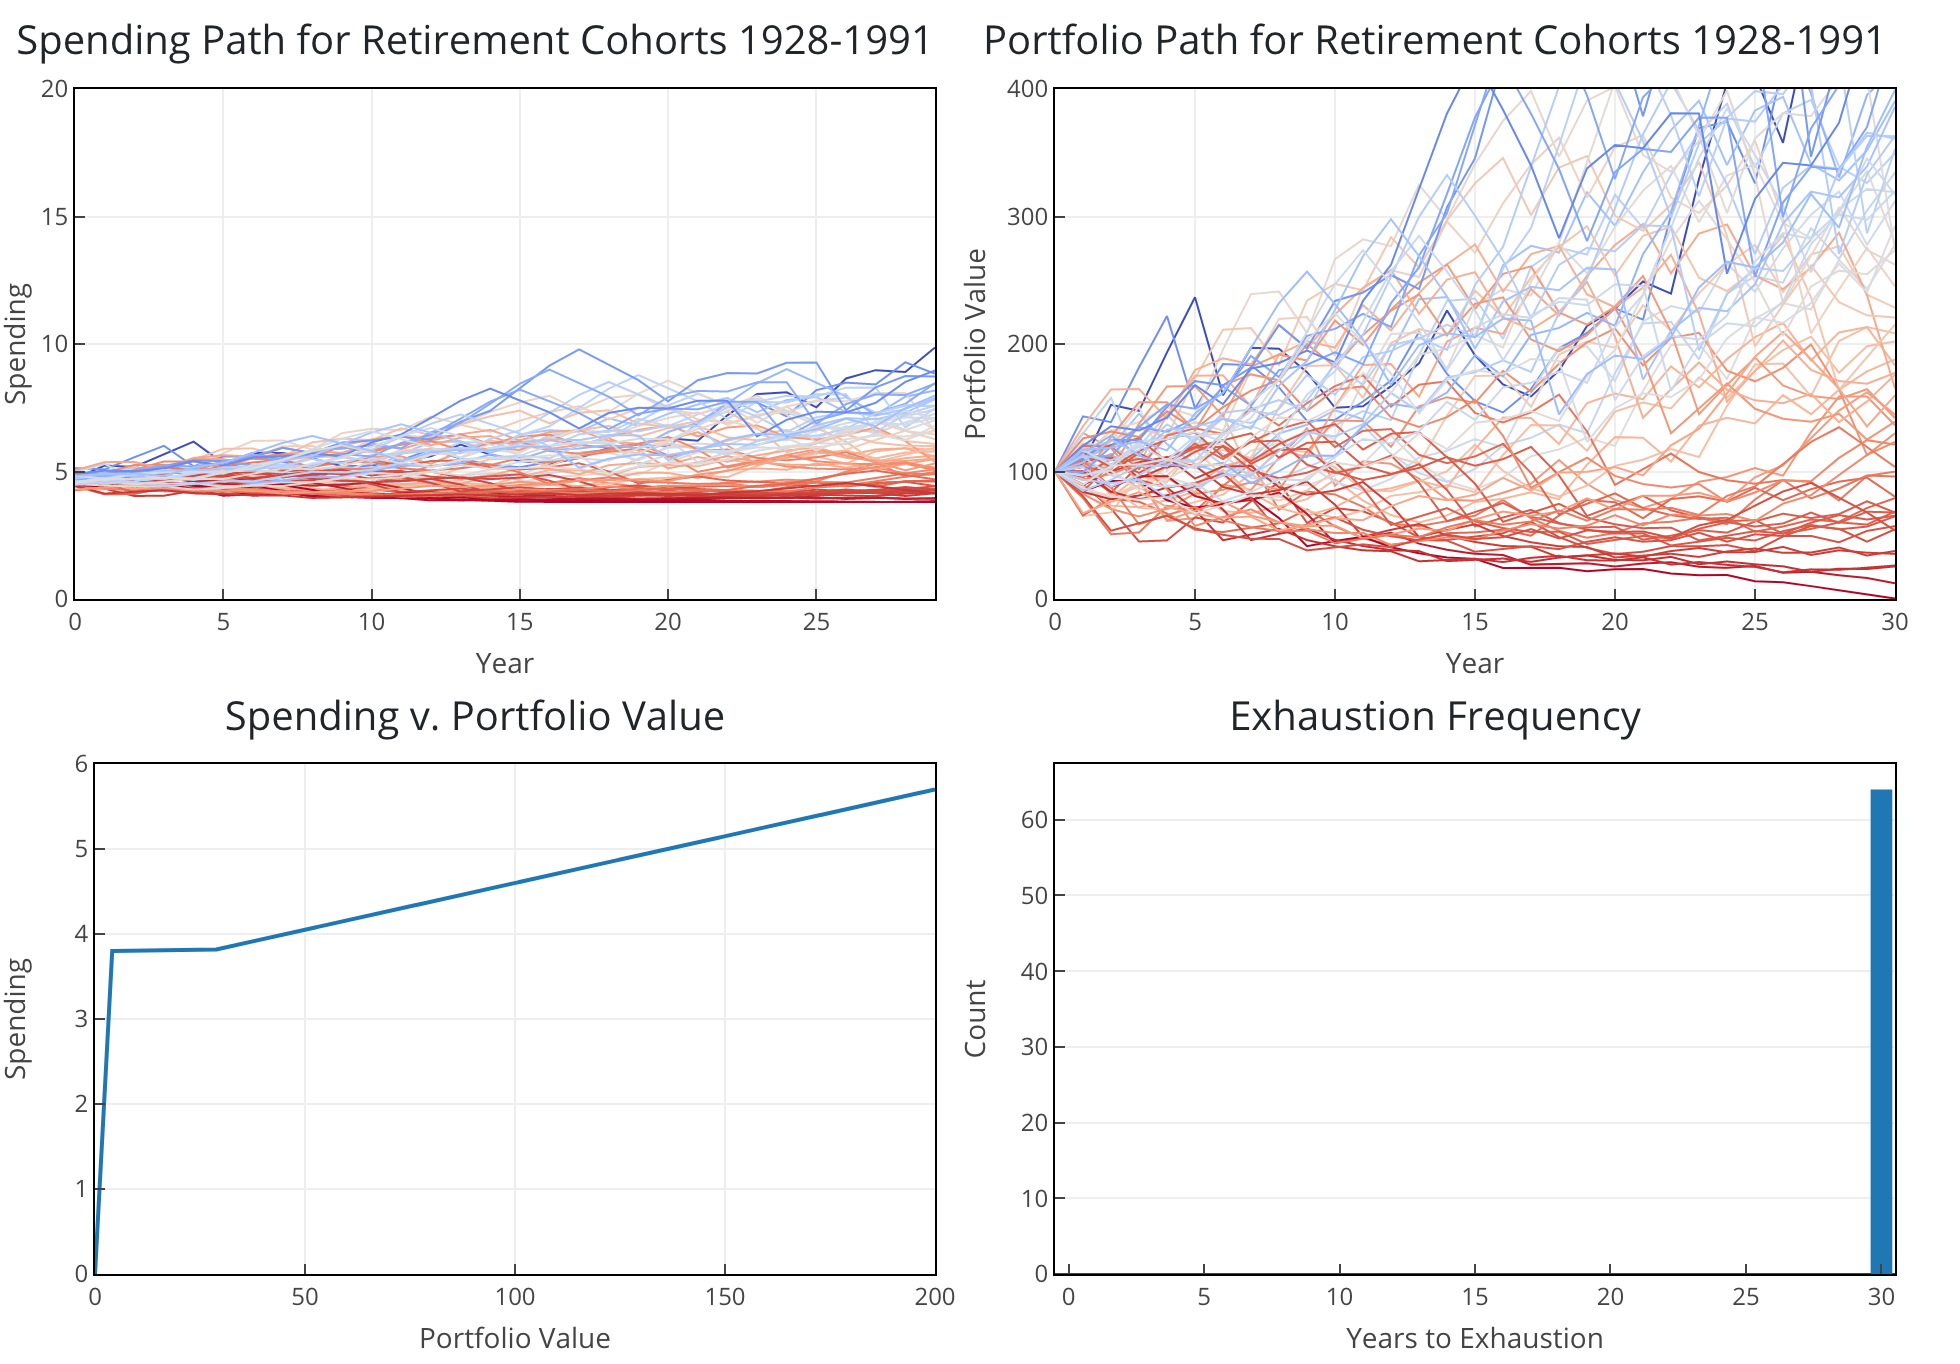
Set asset allocation and fixed/variable withdrawal rates, and visualize historical outcome paths for 30-year retirements 1928-1991. Further discussion in Advisor Perspectives.
NYC subway dashboard
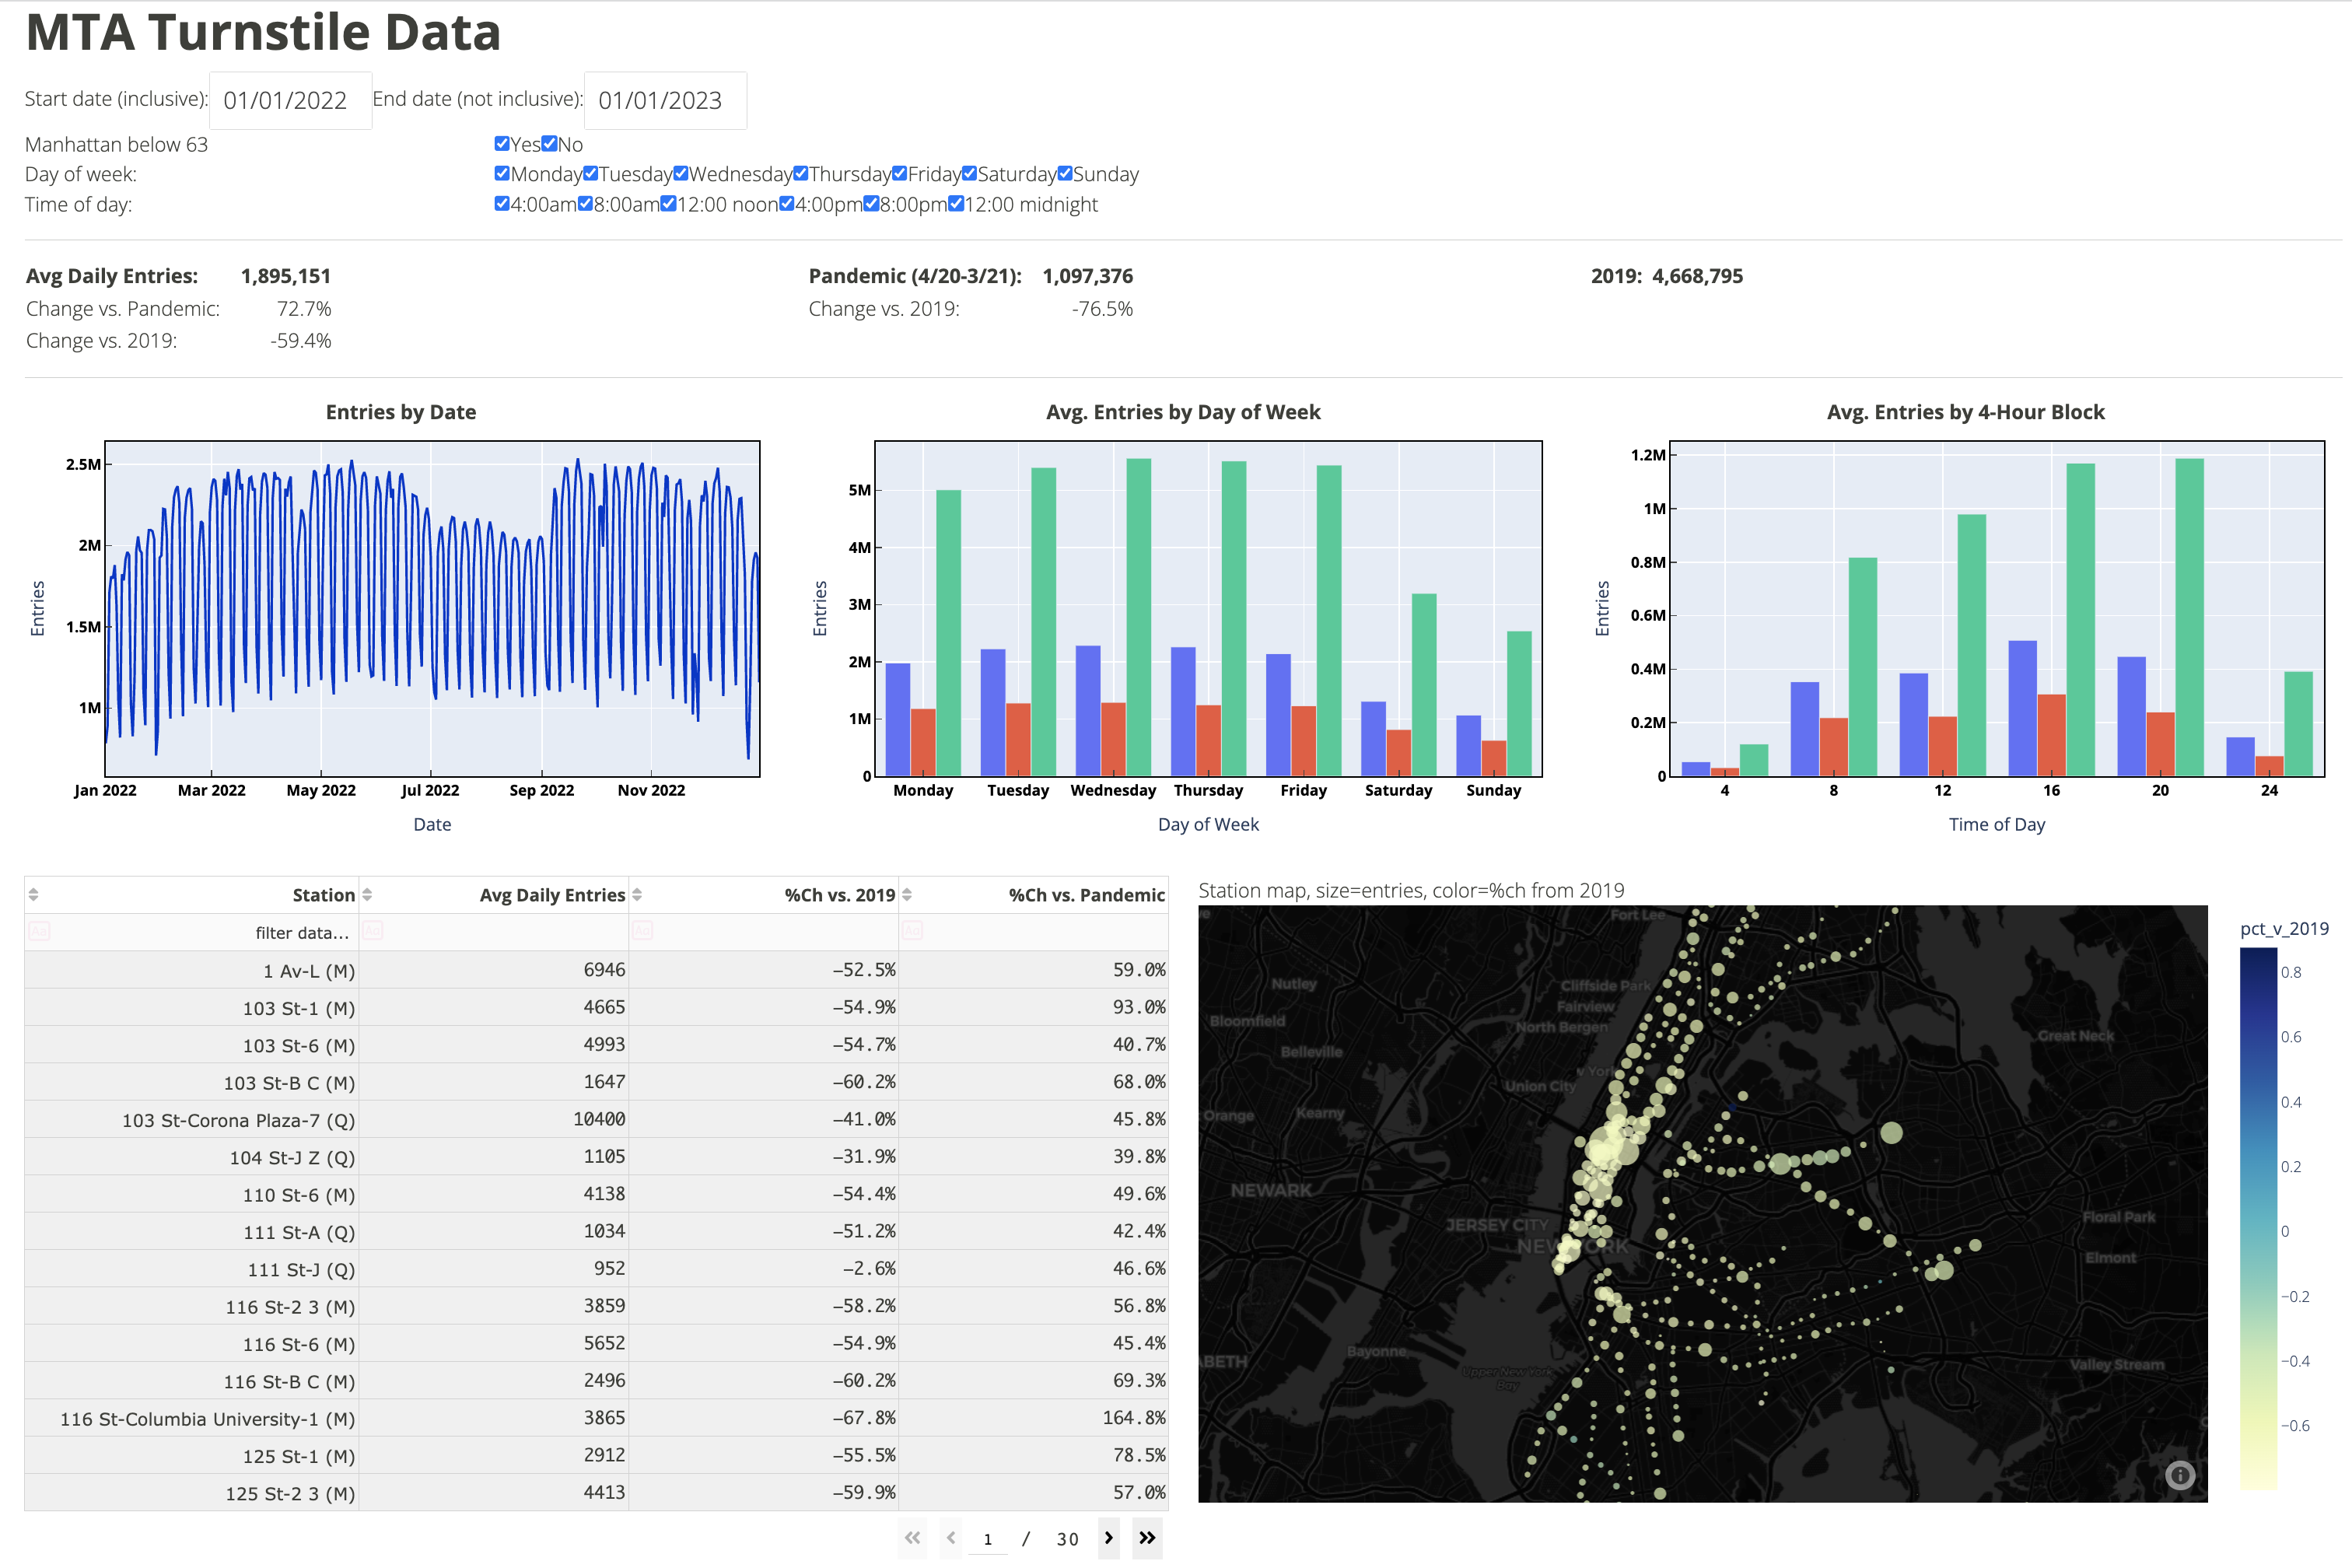
Explore an MTA dashboard data using Plotly Dash, aggregating from turnstile-level data in DuckDB, demonstrating the performance of a column-oriented data warehouse. dbt data pipeline for ingestion and initial transformation. Further discussion in Numbers With Wings: The Modern Data Stack-In-A-Box.
Pizza Pizza Pizza
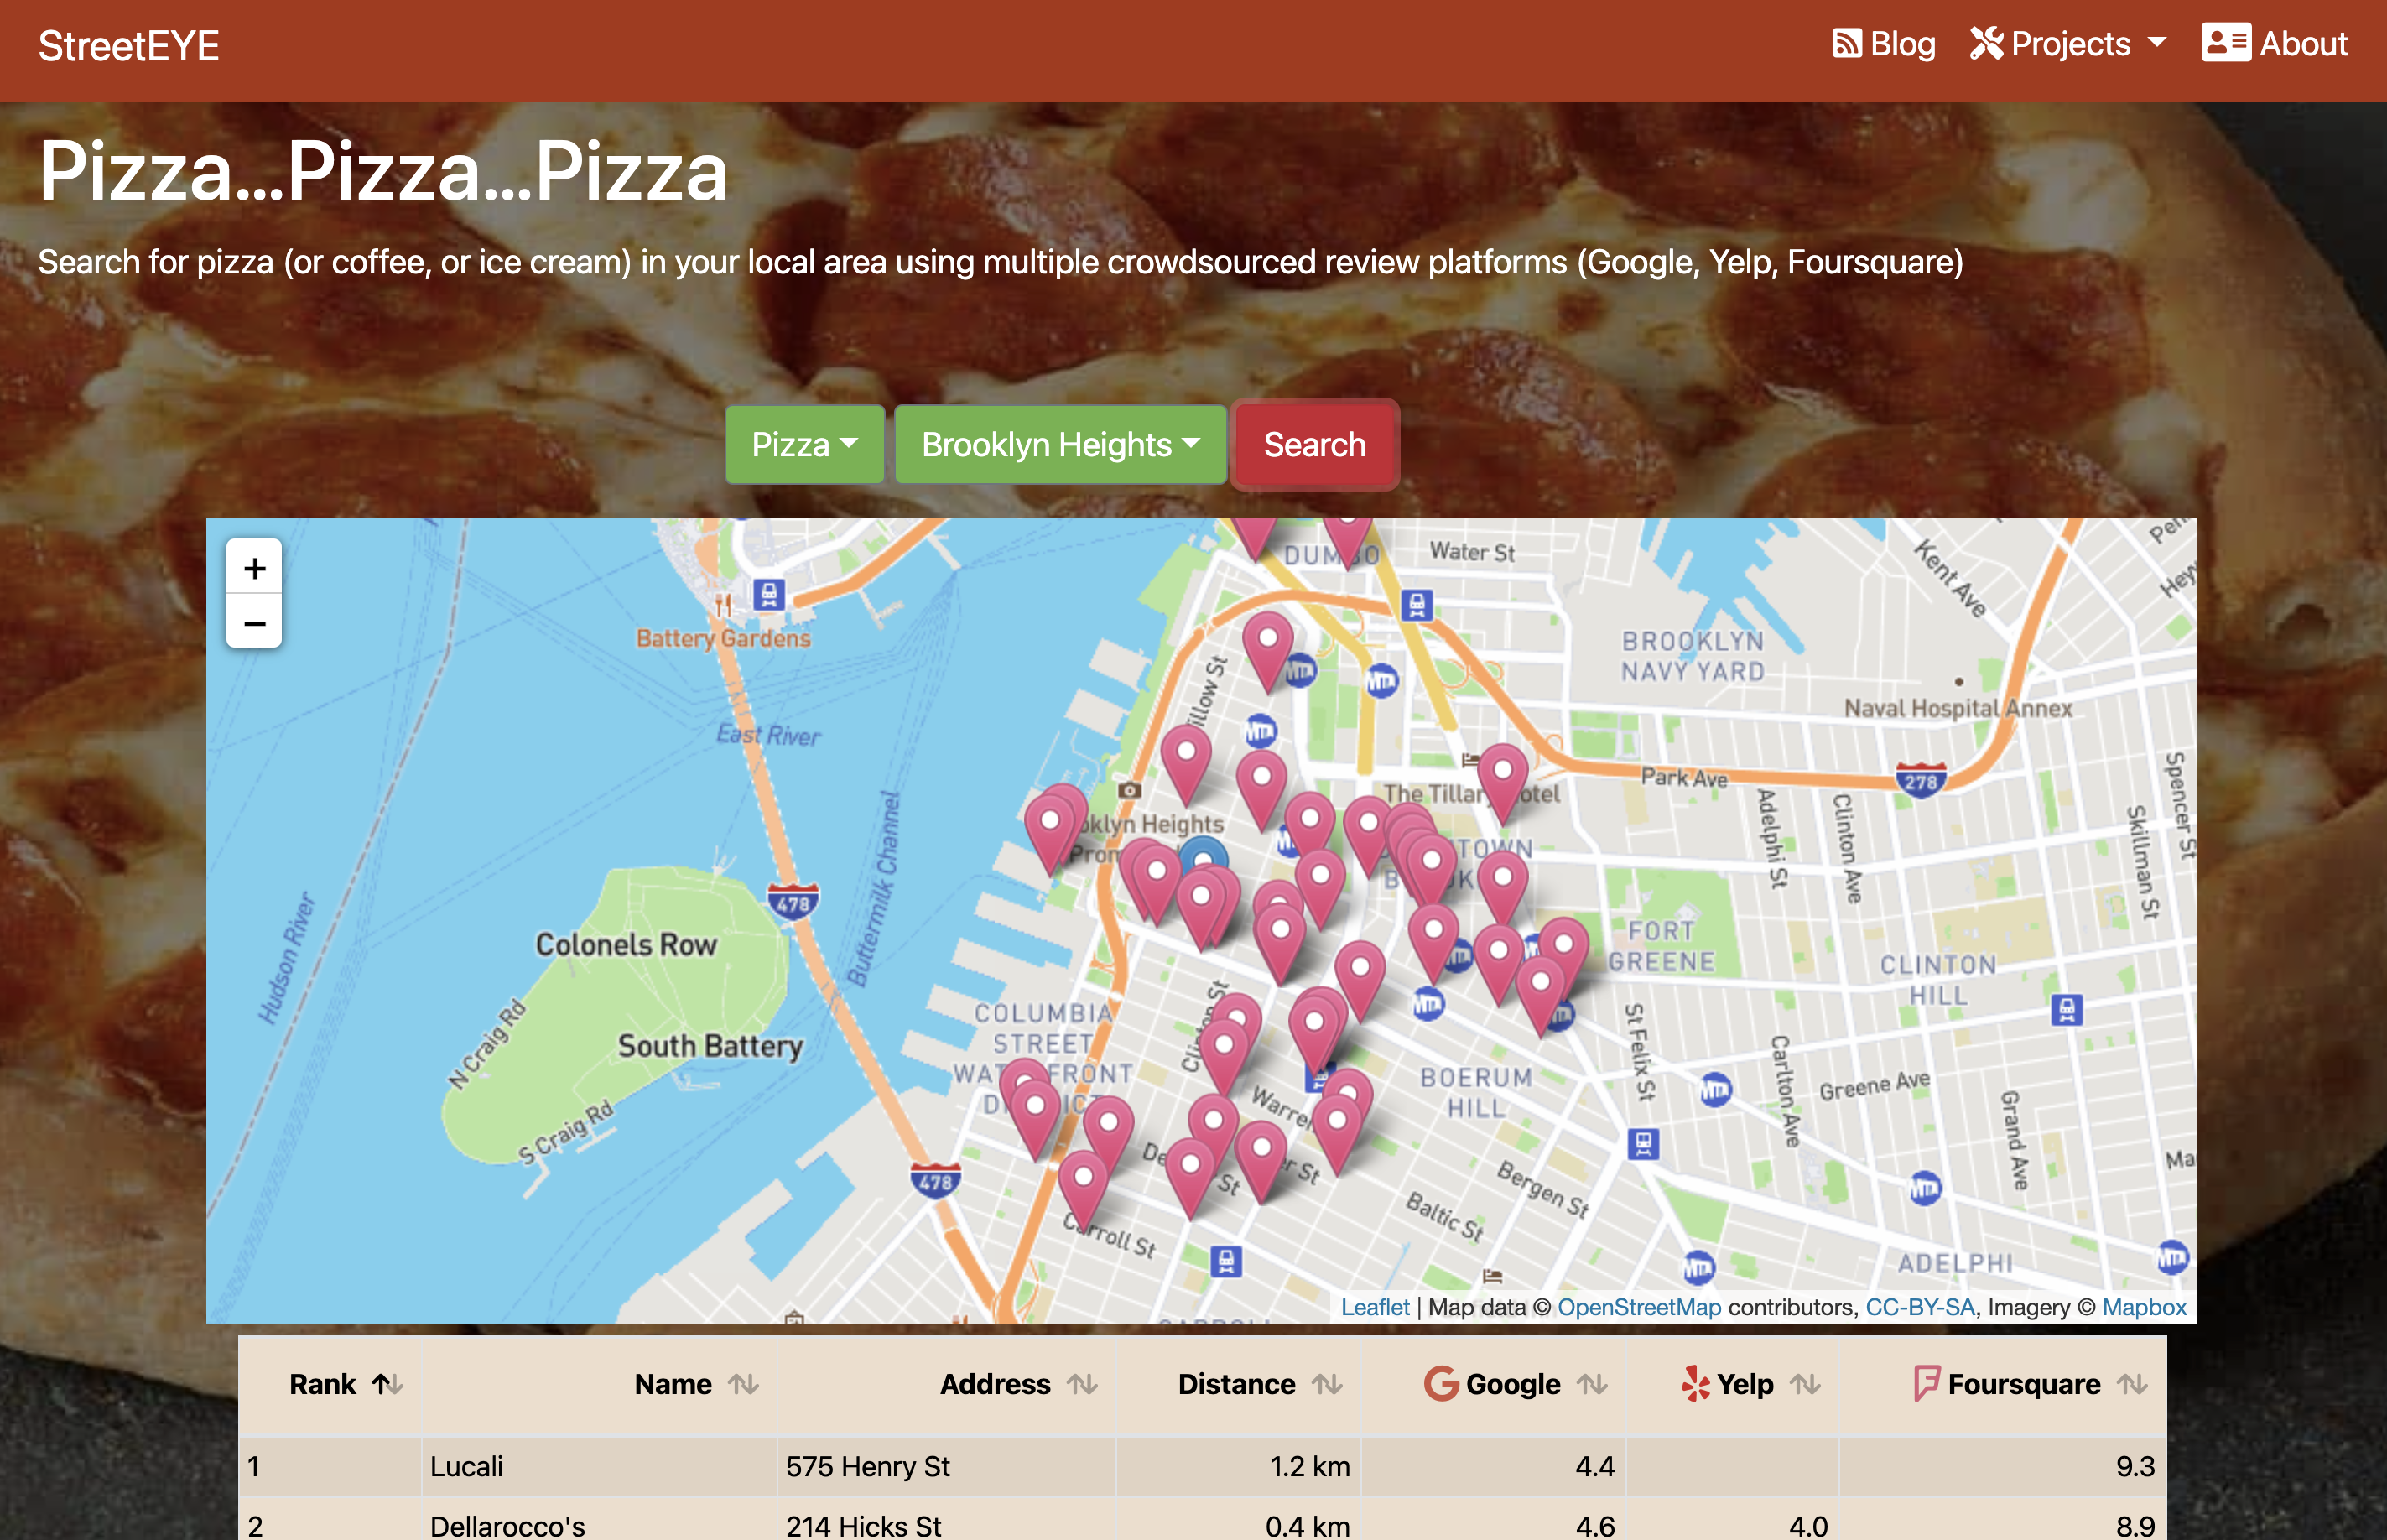
Search for pizza (or coffee, or ice cream) in selected local NY areas, combining Google, Yelp, Foursquare data into a single Bayesian ranking.
Hedge Fund Name Generator
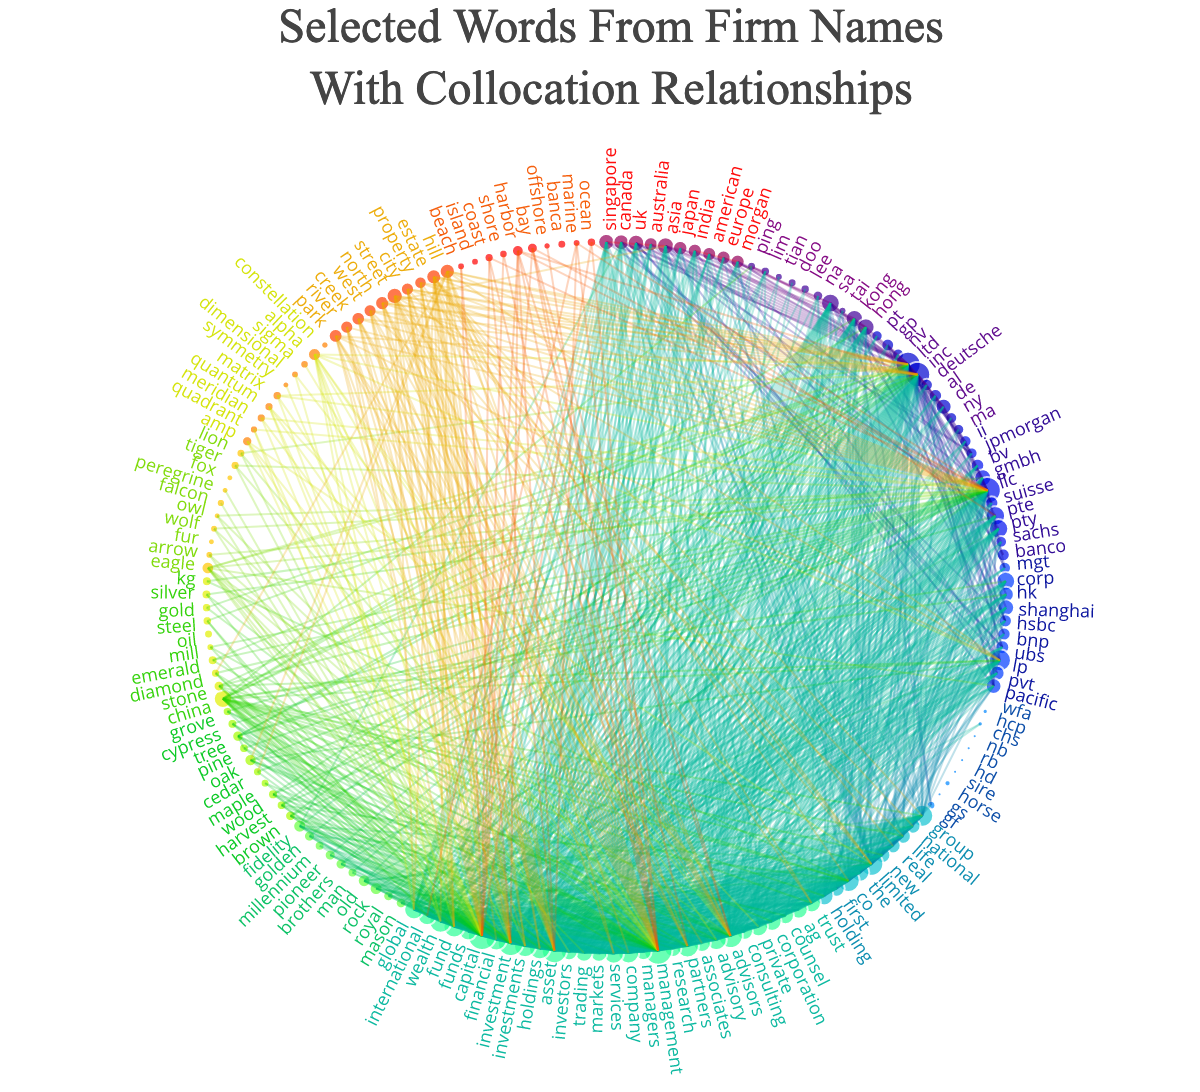
Generate fund names using RNN word completion trained on a dataset of existing funds (blog post).
FinTwit Graph
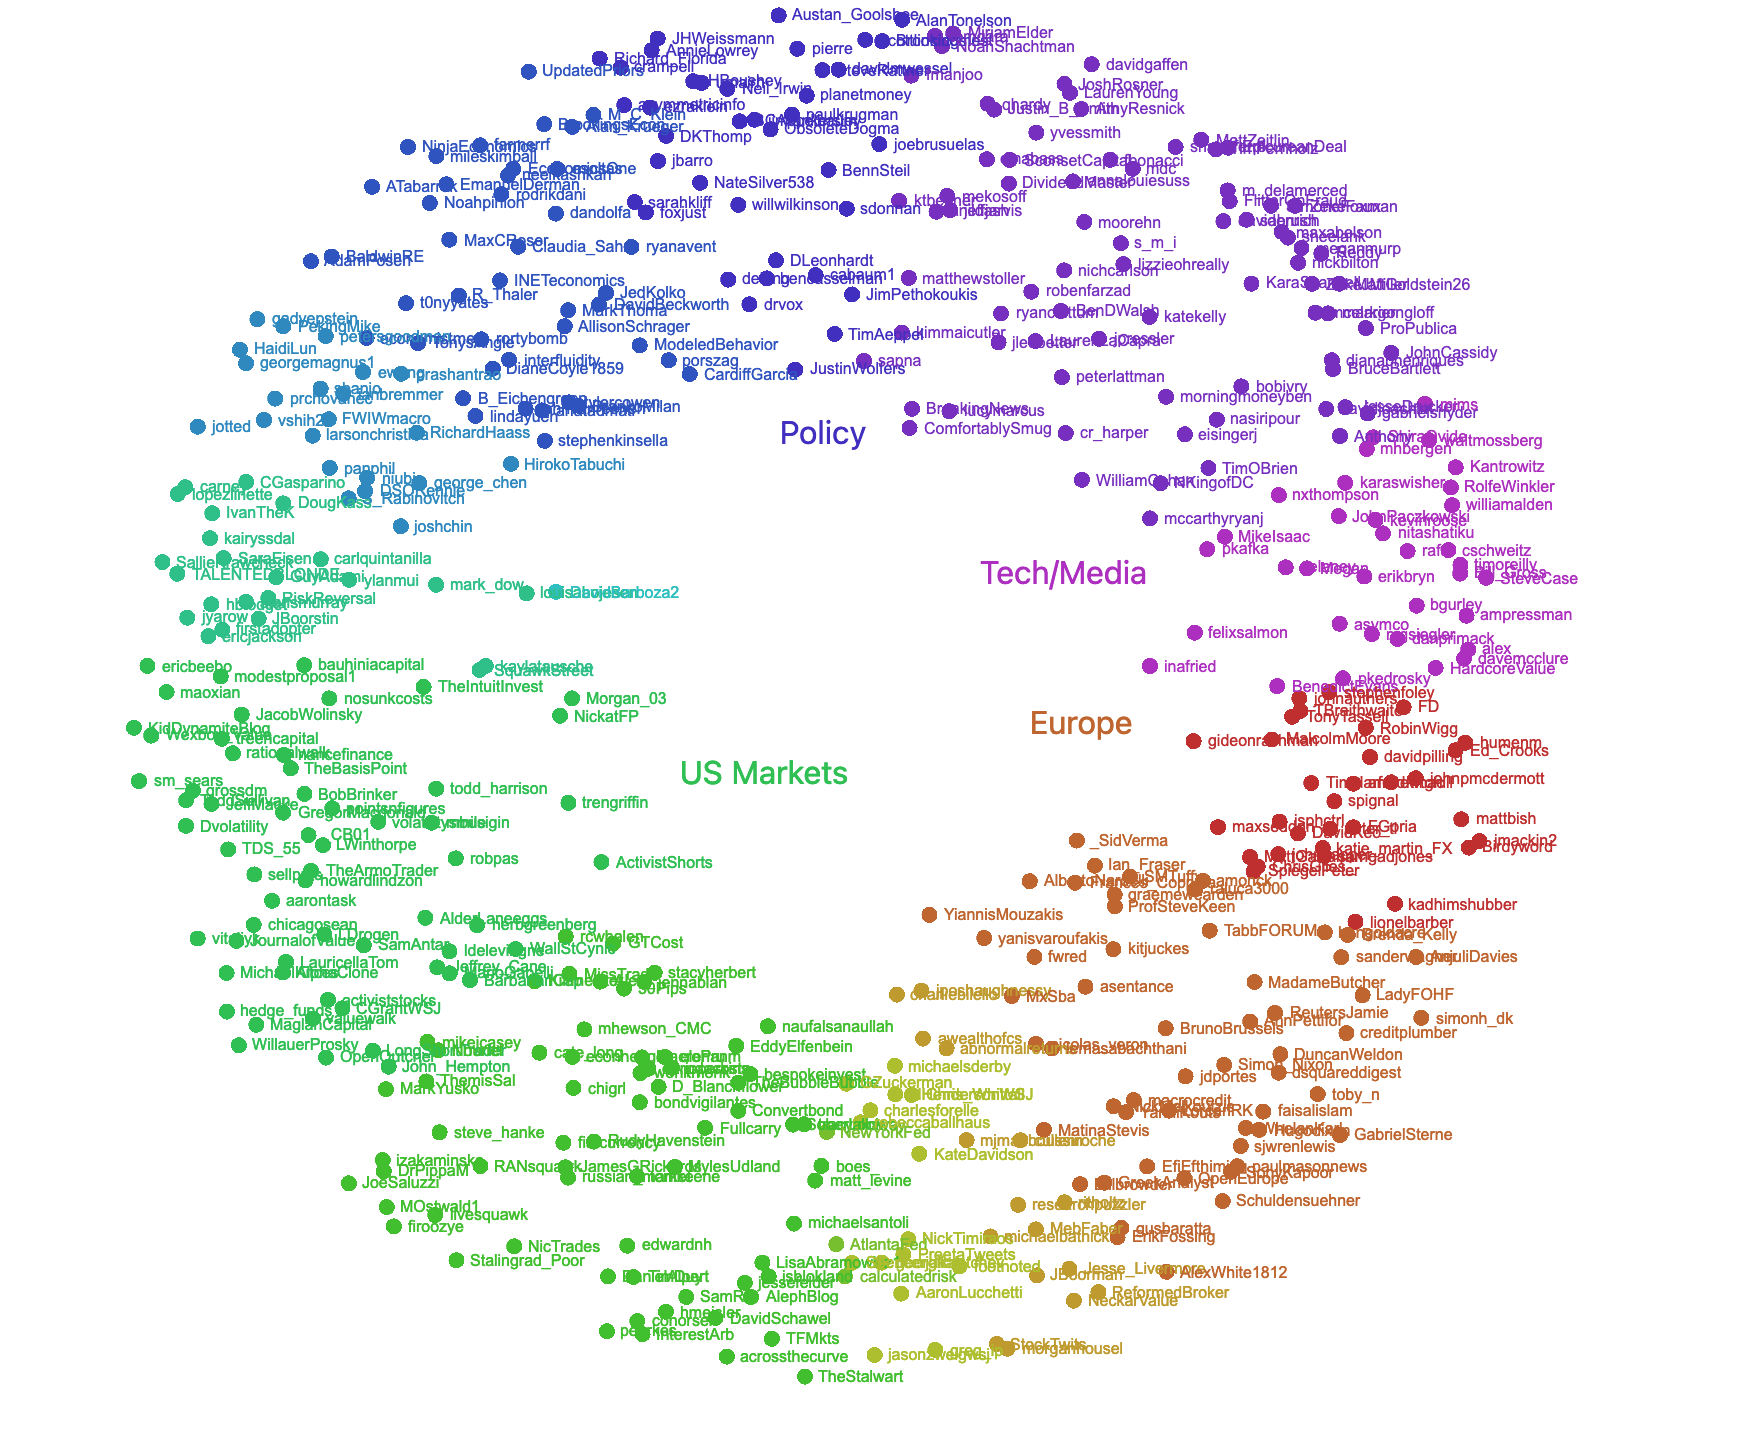
Visualizing the Fintwittersphere, organized by force graph and other neighborhood algorithms using follower and topic similarity
Portfolio optimization in python with CVXOPT
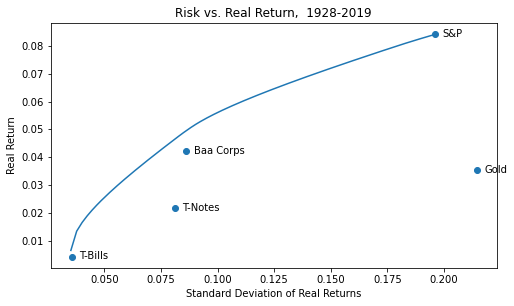
Basic portfolio optimization using historical asset class performance data.
Understanding Classification Thresholds Using Isocurves
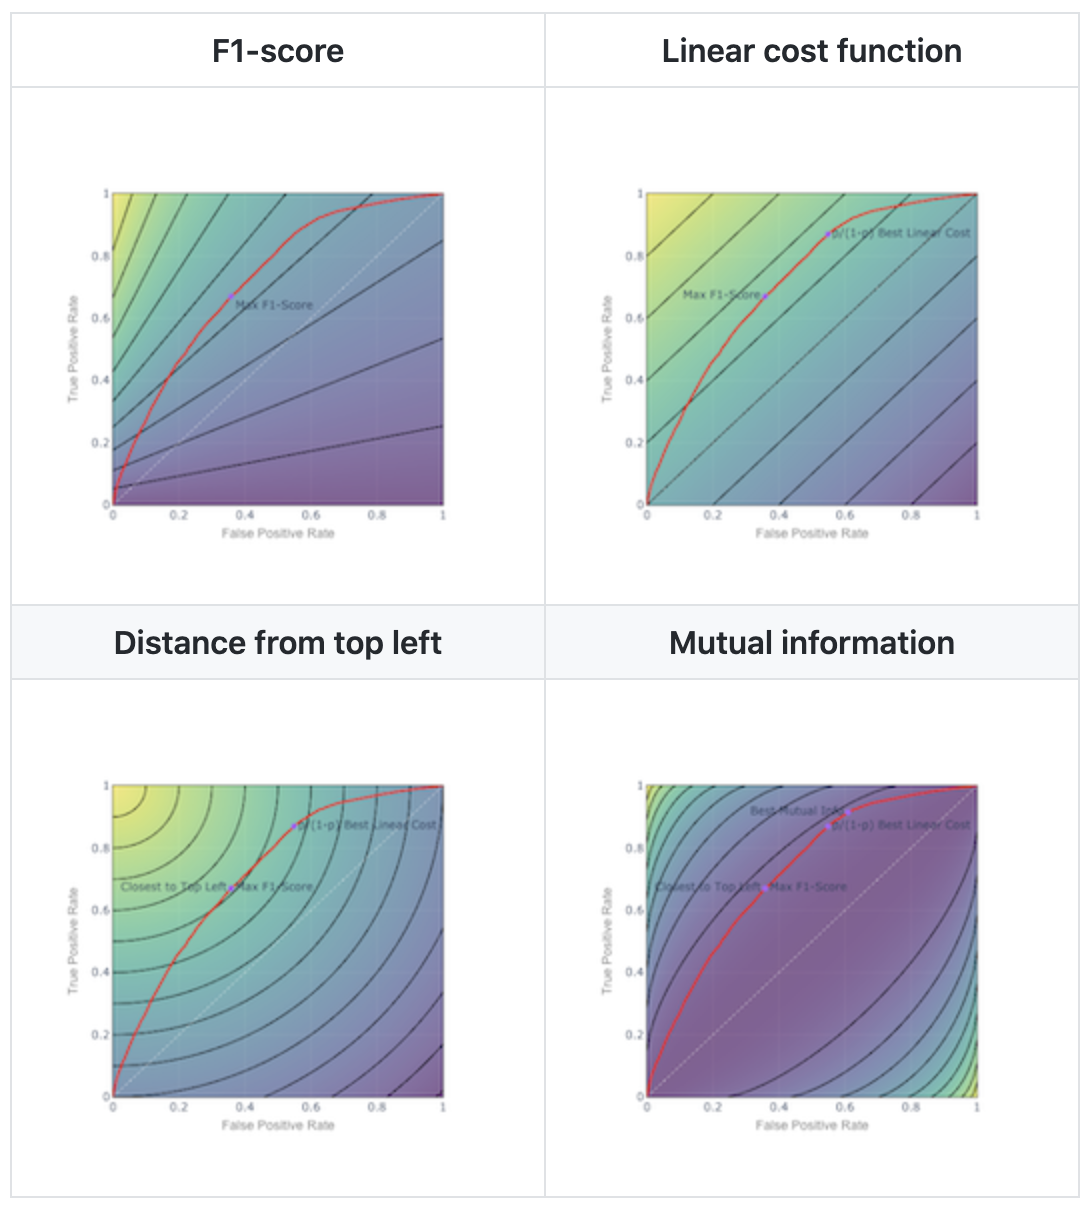
Primer on threshold selection for classification.
Machine Learning For Trading: Classification
Using XGBoost classification to predict stock performance quintiles (a somewhat failed / overfitted experiment)
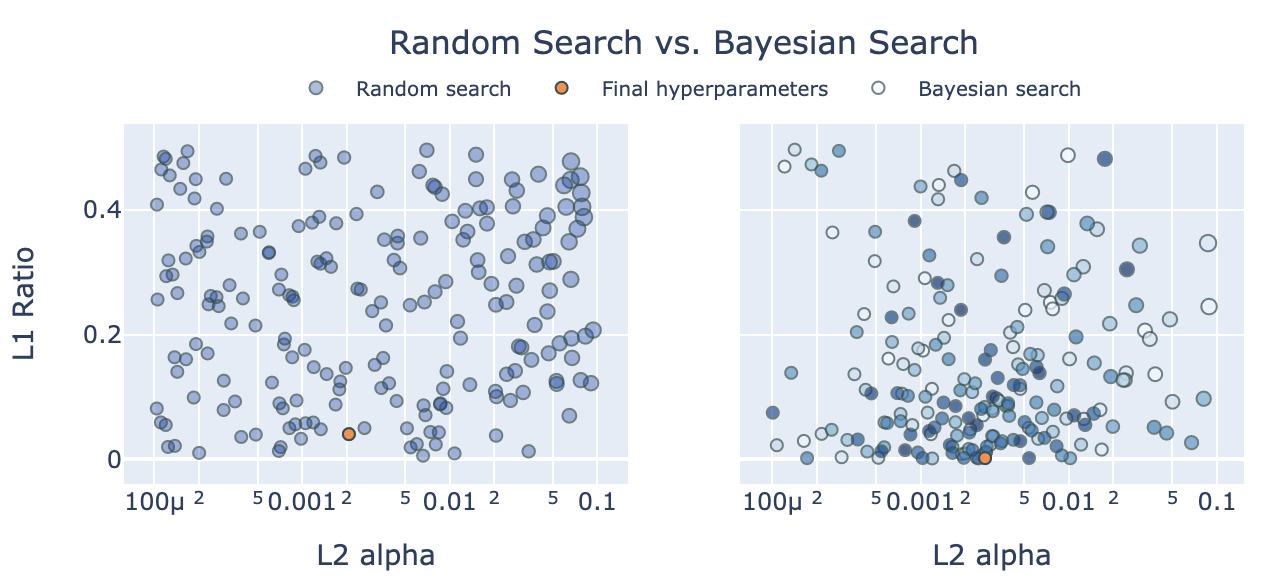
Machine Learning For Trading: Regression
Using Keras and sklearn regression to predict stock performance (low R-squared but with right data sometimes gets results)