Numbers With Wings: A Modern Data Stack-In-A-Box
Not everything that counts can be counted, and not everything that can be counted counts. - Albert Einstein
There are three kinds of people: those who can count, and those who can’t. - Source unknown
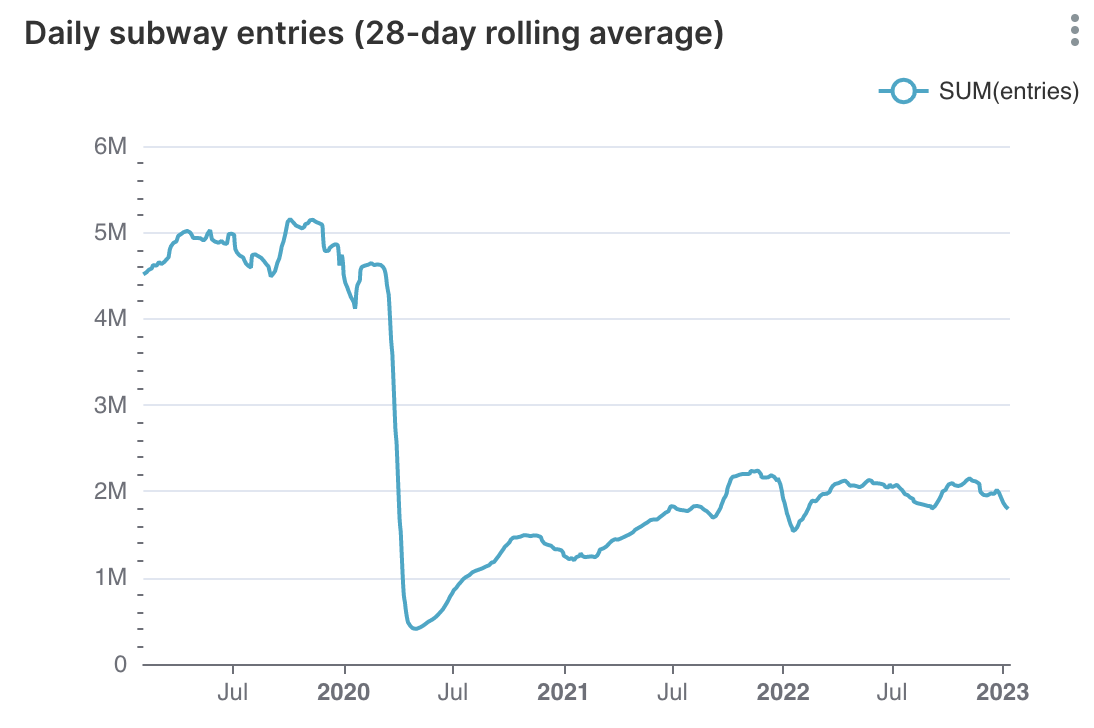
Here is a longer post on creating a performant pipeline for ‘pretty big’ data, on a single box, instance, laptop, or container. The first part is, why do it, what are the components and considerations, and some general rants. Then we’ll set up a stack to analyze MTA turnstile data, which is on the order of 1GB of data per year.
0. Why a data stack-in-a-box?
Some might say, it’s not big data if it fits on a single box, like my laptop. One definition of ‘big data’ used to be, data too big to be reasonably transformed or analyzed on a single box.
When Google first came out, the explosive growth of the Web was reducing the fraction that could be indexed, in most cases to the top couple of pages of a site. What really blew my mind was not just that Google had an order-of-magnitude bigger index and better relevance. But when you ran a search, the results gave not just a URL, but the excerpt on the page that matched your search. Google was caching the text of the entire Web in RAM. A cluster farmed out your search to dozens of stripped-down PCs, cheap circuit boards zip-tied in place, each of which kept a shard of the index in RAM. A query was routed to a cluster, which got the top-ranking result from each shard, also looked up the relevant page and located the relevant excerpt, then sorted all this and assembled it into a results page…in a split-second.
Google clusters were a radical new computing paradigm. They expanded the realm of what was possible.
Today, times have changed. You can fit a lot on a single box. I have a 2019 Intel MacBook Pro with 32GB of RAM; the latest MacBook Pros have up to 96GB. Which is ‘pretty big’ data. With the right stack, you can effectively analyze decades of MTA data down to individual turnstiles.
Is the relevance of cluster computing waning?
Modern CPU architectures like Zen and Apple’s M1 and now M2 change a lot, if not everything. We almost always run multiple virtual servers on a single physical server. It is cheaper to run a giant AMD Epyc box with 192 threads and 384GB of RAM than equivalent compute on individual servers. You can even rent an 8-socket Intel box with 24 TB of RAM! Big data, at least in the sense of tabular data too big to fit on a single box in RAM, hardly even exists outside Big Tech.1 Today CPUs are so powerful that the pendulum may be swinging away from clusters.
Giant multi-core CPUs and systems-on-a-chip (SOCs) change the way software is architected. For super high-performance lightweight microservices you may want to pin each thread to a core, keep everything in CPU cache, and never context-switch. The secret of Apple’s M1 (now M2) is that it’s not just a CPU, it also puts memory, I/O, and GPU on a single chip for massive bandwidth. As Moore’s law sunsets, expanding the envelope is more about giant chips with lots of cores that do everything.
If you can reasonably fit your data on one box, the juice may not be worth the squeeze to build a cluster. Just leverage a big box with many cores, lots of RAM, and massive bus bandwidth.
Scale up is the new scale out, vertical is the new horizontal.
Hence, the data stack-in-a-box.
1. Components of data pipelines and stacks
We can divide what the data stack-in-a-box will do into 3 main tasks, with sub-tasks:
-
Data warehouse, to persist and manage the data, and let us query it and aggregate it efficiently, taking full advantage of all the RAM and cores. Can be called a data warehouse, a DBMS, data lake, lakehouse etc.
-
Extract, Load, and Transform (ELT) tools, to move data into the data warehouse:
-
Tools to fetch data and ingest from REST APIs, CSVs, Parquet, etc. via standard protocols. Built-in connectors for e.g. Zoom or Salesforce data and APIs would be nice.
-
Scheduling and orchestration tools to detect new data and trigger jobs when needed: on a schedule, monitoring a local directory, polling a remote directory or database, receiving an email, triggering on other signals and APIs.
-
Tools to manage dependency graphs (DAGs) to trigger jobs like DB transformations, data quality, ML training, inference, and notifications downstream when jobs succeed or fail.
-
-
BI: Front-end frameworks to create data visualizations, reports, dashboards, and end-user apps.
There are also additional pieces, like monitoring pipelines in production, data quality, and data governance. You can go pretty deep. But if you’ve handled these concerns, you have a pretty good start.
An aside: Why ELT and not ETL? Earlier online analytic processing (OLAP) manifestations processed data into cubes, sort of like a spreadsheet with a pivot table within a database, to batch pre-process aggregations and enable real-time drill-downs. Modern data stacks just keep data in raw form (or close to it) and leverage parallel processing to transform on the fly, obviating the need for preprocessing and determining up front what dimension will need to be aggregated. we give each core a shard of the data in ram. then each node can do its part of aggregations and drill-downs and send the results to a controller for final compilations, Google cluster paradigm style. in contrast to a client/server paradigm which moves data from raid disks over a network, we marry individual slices of ram data to their own dedicated compute. elt is what makes a data stack modern, in contrast to old-school ETL. in practice, however, we usually end up with ETLT: extract; clean up a little; load to our data warehouse in a clean, but unaggregated form; and finally aggregate and drill down on the fly.
How do we build a basic modern data stack with MTA turnstile source data to power dashboards like the NYS Comptroller site or this or this?
One way is an enterprise-ish ‘on-prem’ approach (typically in a private or public cloud these days):
- Storage + compute: Spark cluster
- Data pipeline / ELT: Airflow, Dagster, dbt, Fivetran, Stitch, Airbyte
- Dataviz: PowerBI, Tableau, Superset for dashboards and dataviz; Django web framework, Appsmith low-code framework for apps
Another approach is ‘cloud-native’, using pay-as-you-go SaaS cloud services connected over the public Internet:
- Storage + compute: Cloud lakehouse like Snowflake or Databricks hosted Spark
- Cloud pipeline / ELT SaaS: Astronomer hosted Airflow, Prefect, Dagster Cloud, dbt Cloud
- Cloud dataviz SaaS: Tableau Cloud, PowerBI SaaS, Preset hosted Superset; Retool, Appsmith Cloud for end-user apps
- And the major cloud platforms each have their own native stacks of data warehouse, ELT/orchestration, and BI. There’s a tradeoff between using an integrated stack from a major vendor vs. assembling a stack from best-of-breed components.
With a cloud-native stack, SMBs can run their business more or less completely on SaaS services like Salesforce, Square, NetSuite, Mailchimp, Twilio, Qualtrics, Zoom etc. Who needs devs and system admins and MSPs? When you want to build a workflow app, for instance to manage a big conference, create some Zoom meetings, send some emails, texts, Slack/Discord messages, and get paid, build a front end in low-code platforms like Retool to talk to all those SaaS services. And then Tableau or PowerBI SaaS for dashboards and reporting.
2. Our data stack-in-a-box: DuckDB, dbt, Superset
But I’m not going to build any of these heavyweight solutions, I want a lightweight data stack-in-a-box to pull ‘pretty big’ data, aggregate along various dimensions, and display a dashboard on my MacBook or in a container. Tech we will leverage:
-
Duckdb: like SQLlite, but for column-oriented data. It’s a lightweight data warehouse that does high-performance multithreaded aggregation using SQL. Columnar databases are faster for OLAP than row-oriented OLTP databases like Postgres.2 When we have e.g. millions of rows of e.g. double-digit columns, we usually get orders of magnitude improvement in size/speed using a columnar format like Parquet vs. CSV with binary storage and compression.
-
dbt: the database build tool. From your data warehouse’s perspective, dbt is simply a SQL client. From the standpoint of a dev writing SQL transformations within your data warehouse, it’s a structured scripting framework on top of SQL. dbt is to SQL sort of what PHP and WordPress are to HTML. dbt provides a structured framework for data pipelines with dynamic SQL scripts. You get almost for free: DAG workflow; logging; self-documentation of every table’s provenance; parameterized SQL templates for modularity and re-use, and the ability to point any script to dev, test, and production environments.
-
Superset: an open-source version of Tableau or PowerBI to run a dashboard.
This works pretty well (Code here). It seems to be an order of magnitude faster than raw Python Pandas on ‘pretty big’ data. It’s pretty cool, if you grew up in a world where Google didn’t exist, to compute Google-style on your laptop or a $20 Hetzner or AWS box. It’s similar enough to production-ready processes that when the time comes to move from your laptop to ‘real’ enterprise infrastructure, whether SaaS or ‘on-prem’, you will be using pretty much the same paradigm.
DuckDB has some limitations. It is a single-user server. It writes to a single file. But it leverages all your RAM and cores in SQL aggregation and other operations. If you swap out DuckDB for Spark which will also run fine on your single box or laptop, this data-warehouse-in-a-box is an OK starting point for an enterprise stack.
If you are a normie business, just get Databricks (hosted Spark) or Snowflake (SQL data warehouse). No offense to others but those are the dominant SaaS solutions. There are a lot of ways to slice the salami. This dude even has a ‘post-modern’ data stack.
Today, rolling your own on-prem production modern data stack from open source is for teams with scale. Or penniless startups and hobbyists who don’t want to pay for SaaS services. Which is probably not most teams. Regardless, in the rest of this post, we stand up our own small environment for a data app.
3. Requirements and initial DuckDB ingestion
Hardware
- The size of the data you can process fast will scale with RAM.
- The speed at which you can process data will scale with cores.
- I am running on a 2019 MacBook Pro with 32GB and 8 cores. If you run on a cloud instance, I would recommend starting with something like r6a.xlarge: AMD CPU, 32GB RAM, 4 cores.
Software
- I will run everything on my Mac in a conda virtualenv.
- Ubuntu 20.04 or any OS that runs Anaconda should work: Windows, Linux, or Mac. The Amazon Deep Learning AMI is nice for machine learning in general but we are not going to use ML or GPU.
- Python 3.8, I don’t expect all modules to be 100% debugged and tested on the latest Python 3.9 and Ubuntu 22.04 as of this writing.
Install
- Clone the repo into a local directory.
git clone https://github.com/druce/MTA -
Download and install the appropriate Anaconda for your OS.
$ wget https://repo.anaconda.com/archive/Anaconda3-2022.10-MacOSX-x86_64.sh $ ./Anaconda3-2022.10-MacOSX-x86_64.sh $ conda init # (optional) update .bashrc etc. $ conda update conda # (optional) check for updates to base -
Make a virtualenv and install DuckDB
$ conda create -n mds python=3.8 $ conda activate mds $ pip install duckdb duckcli pandas -
If using Jupyter, add SQL magic for DuckDB and add
mdsvirtualenv as a Jupyter kernel$ pip install duckdb-engine ipython-sql sqlalchemy ipykernel $ python -m ipykernel install --user - Download and load the data into a DuckDB database mta.db.
$ python 0-download_data.py
$ python 1-ingest_data.py
4. Pipeline Overview
At this point, you should be able to do jupyter notebook and open MTA-DuckDB.ipynb . In a nutshell:
- Load raw data into DuckDB
- We have 1 row per turnstile per station per approximately 4-hour period
- Do some basic cleanup
- Make clean unique turnstile and station labels each in a single column
- We have cumulative turnstile counters, so we first-difference them after grouping by turnstile, to get net entries and exits by period
- Fix large outliers where presumably maintenance was done and counters were reset, remove negative or anomalously large entries/exits
- Compute aggregations like total entries by date, and visualize
5. dbt Initial Build / Transform
Install, configure, and run dbt
- Install
$ pip install dbt-duckdb -
Configure: edit dbt’s profiles.yml config file to point to the directory where you cloned the MTA repo. Put it in your home directory under
~/.dbt/. dbt keeps these credentials and connection profiles here by default to avoid putting credentials in git repos. - Run (these shell commands are in
build.sh; edit your directory name)
  $ # environment variables for python models that load data
  $ export BASEDIR="/Users/user/projects/MTA"
  $ export DBFILE="mta.db"
  $ export DATADIR="downloads"
  $ cd dbt_mta
  $ dbt debug  # check connection profile
  $ dbt seed   # load small static map tables from dbt/seeds
  $ dbt run    # download data and run build pipeline
  $ dbt test   # run tests
- On my Mac, this takes about 4 minutes to run on 5GB of data, not including the HTTP download but including the initial DB ingestion from .txt files.
- For comparison, the first version of the analysis that I wrote in pure Pandas without DuckDB takes about 30 minutes. With Modin multi-threaded dataframes as a drop-in replacement for Pandas, this is cut to about 20 minutes. The comparison is not a valid benchmark since the transforms are not the same. Someone should do a proper benchmark.3 But this should give an idea of the benefits of a modern data stack.
Full dbt walkthrough
The above uses the repo’s fully set-up dbt project. Let’s build it step by step from scratch so you can see what goes on under the hood and get a quick tour of dbt.
- Back up the existing dbt directory
$ mv dbt_mta dbt_mta.sav - In the MTA directory, run the below to create the scaffold of the project:
$ dbt init dbt_mta $ cd dbt_mta $ ls # inspect contents # At a minimum we need profiles.yml in ~/.dbt, dbt_project.yml and models in models directory $ dbt debug - You should see
All checks passed. If not, debug the.dbt/profiles.ymland thedbt_project.ymlso everything is in sync. - Set up seeds (small static tables)
cd seeds cp ../../dbt_mta.sav/seeds/*.csv . cp ../../dbt_mta.sav/seeds/schema.yml . # maybe inspect those files, seeds/schema.yml has some schemas, docstrings, tests cd .. dbt seed cd .. duckcli mta.db show tables select * from station_label_override exit - You should see that 3 small tables have been created from the csv and schema files:
station_label_override,division_label_override,station_map - Now we create our models
cd dbt_mta/models cp ../../dbt_mta.sav/models/*.py . cp ../../dbt_mta.sav/models/*.sql . cp ../../dbt_mta.sav/models/*.yml . # maybe inspect those files, models/config.yml has some model schemas, docstrings, tests cd .. dbt run --select download_data dbt run --select ingest_data - dbt doesn’t talk HTTP or load data natively, it runs SQL transforms within the data warehouse. It expects raw data to be pre-loaded. For now, we have a couple of Python scripts to download and ingest, as models in the models directory. These
dbt runcommands just run the Python scripts within the dbt context. - .sql files in the models directory run sql queries to create tables according to the model name
- .sql models refer to existing tables with
{{ref}}Jinja tags, creating a DAG defining the order of execution. - To run and test the whole pipeline, type:
dbt run dbt test - To view documentation run:
$ dbt docs generate $ dbt docs serve -
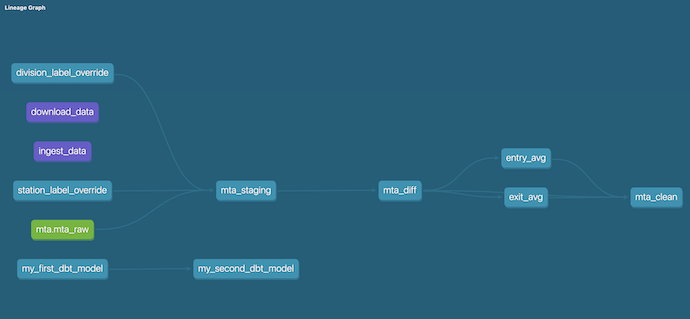
This allows you to browse the project documentation, and if you click ‘View Lineage Graph’ at bottom right on the Database tab, you should see something like:
- There is more to dbt:
dbt is probably something everyone should try for non-trivial pipelines. There isn’t anything wrong with writing a pipeline based on a sequence of Python scripts. But over time you will tend to standardize your script and turn it into a template. Then at some point maybe you will want to make a change everywhere. You might end up with a lot of scripts, and some data engineers who are better at SQL than Python, and it could get messy. dbt provides a standard framework out of the box that gives you a lot of stuff almost free: documentation, logging, modular templates. It’s lightweight, there’s not much lock-in (outside dbt Cloud anyways), most places use it.
6. Superset dashboard
I install Superset into my Mac conda virtualenv. The install varies a bit by platform, see the instructions. I found I had to pin a couple of module versions, which was a drag to figure out. You can install a Docker image, which should be straightforward if you have Docker, just mount the directory where the mta.db DuckDB database lives.
# prereqs
# install or upgrade Xcode
xcode-select --install

# install or upgrade Homebrew https://brew.sh/
brew upgrade
brew install readline pkg-config libffi openssl mysql postgres

# make virtualenv
conda create --name superset python=3.8
conda activate superset

pip install --upgrade setuptools pip

export LDFLAGS="-L$(brew --prefix openssl)/lib"
export CFLAGS="-I$(brew --prefix openssl)/include"

# install
pip install apache-superset

# at this writing these versions must be pinned
pip install --force-reinstall cryptography==38.0.4
pip install --force-reinstall wtforms==2.3.3
pip install --force-reinstall flask==2.1
pip install duckdb-engine Pillow

# Create an admin user in your metadata database (use `admin` as username to be able to load the examples)
export FLASK_APP=superset
superset fab create-admin

# Create default roles and permissions
superset init

# To start a development web server on port 8088, use -p to bind to another port
superset run -p 8088 --with-threads --reload --debugger
After a some wrangling, I get a dashboard that looks like this (2022 filter applied):
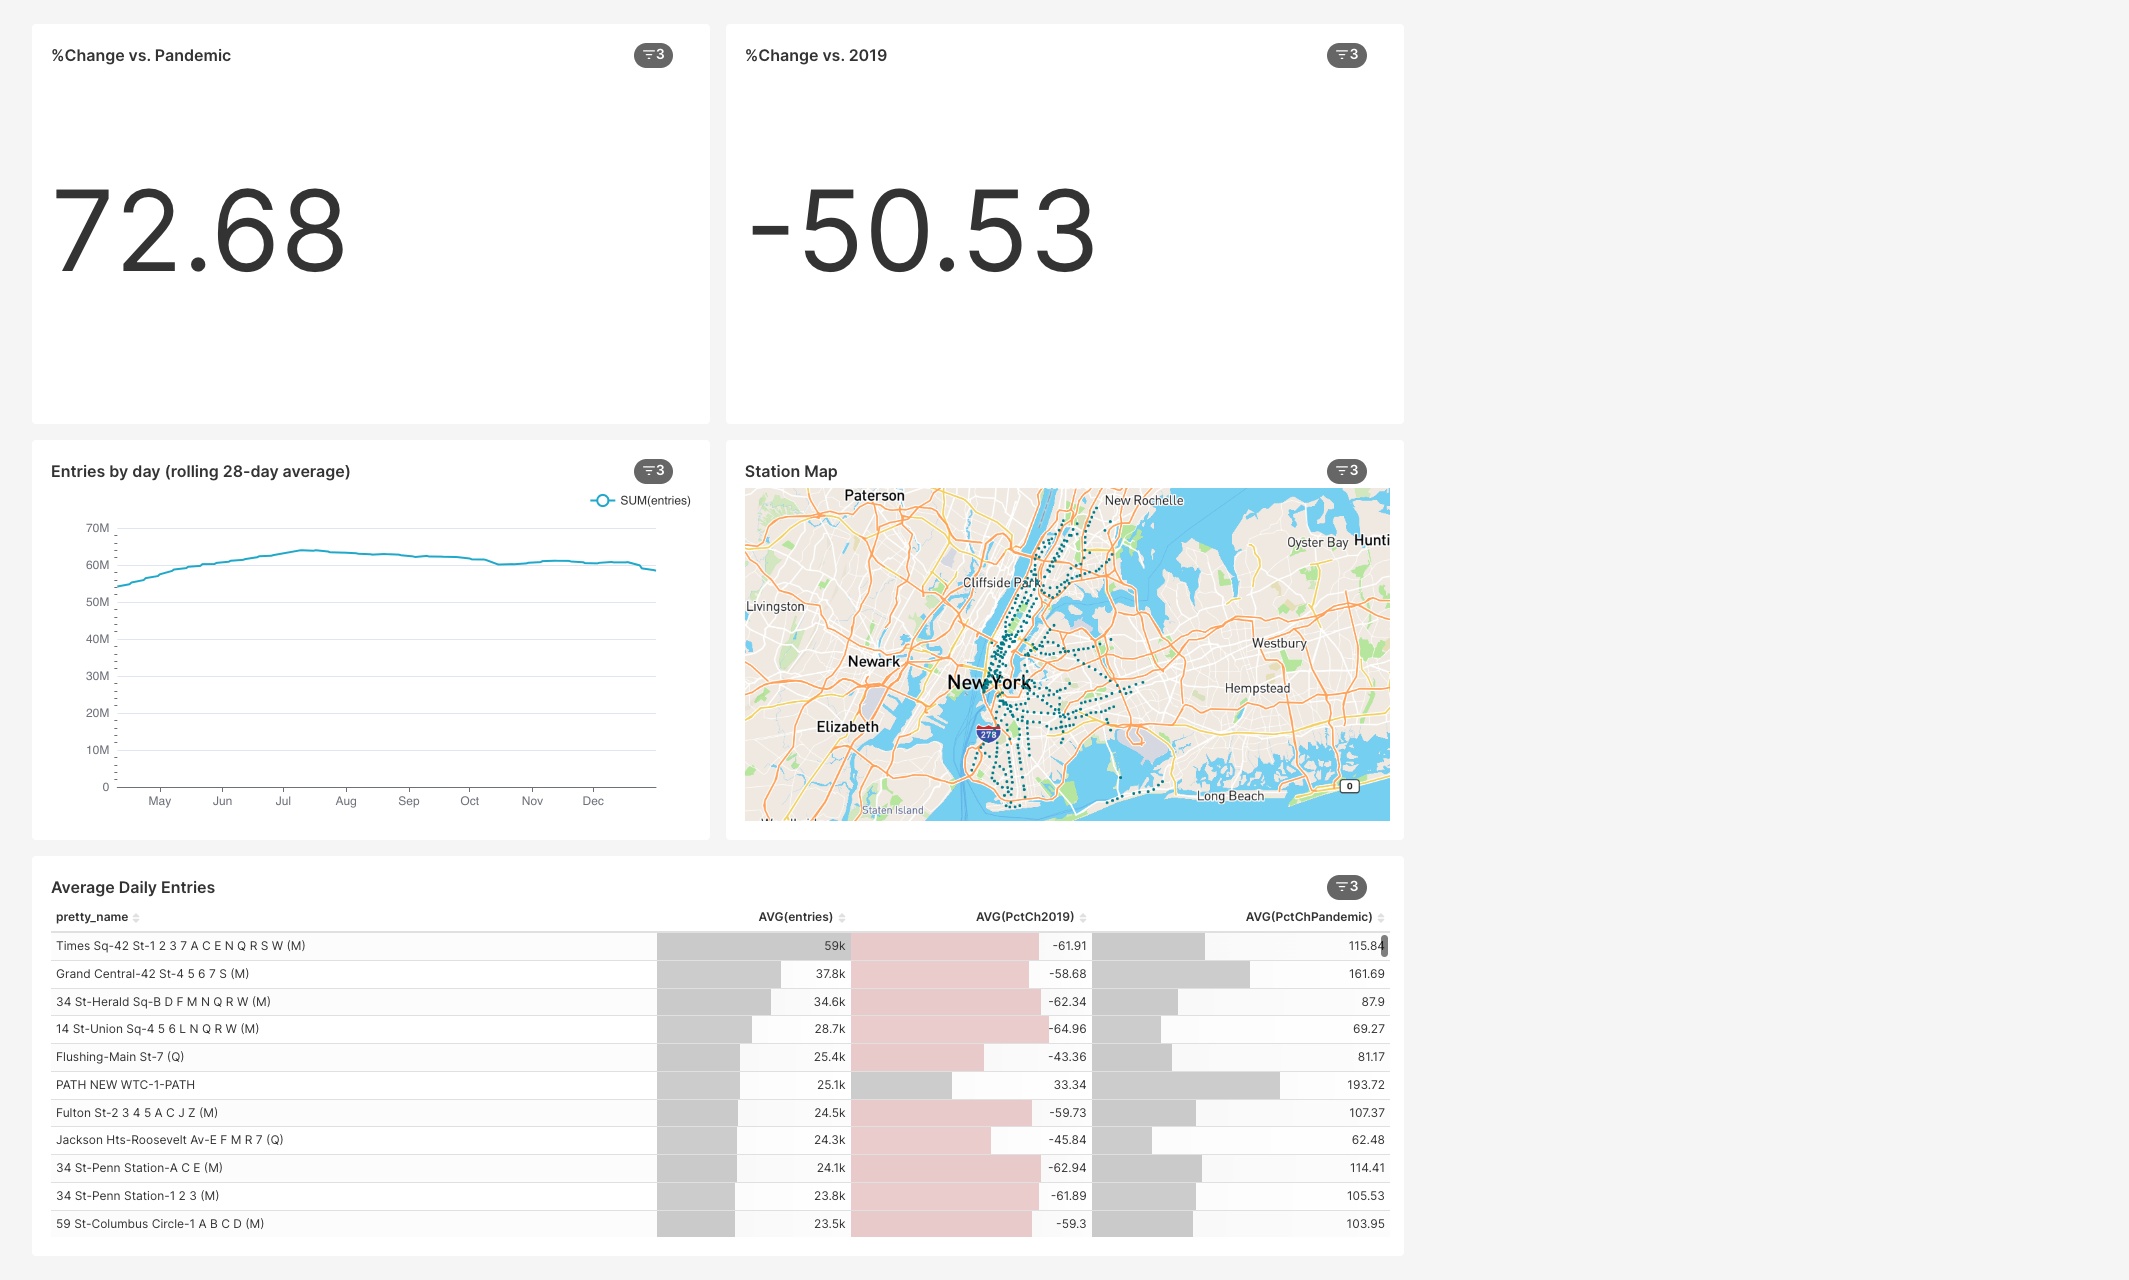
Superset is a poor man’s Tableau. These tools are no-code, modulo some SQL, and look great with minimal thinking about design. Superset is powerful but complex and quirky. It was not as straightforward to create this as I expected. That being said, we can filter by a date range and see a comparison with pre-pandemic and pandemic periods, we can filter by Manhattan below 63 St, by day of the week, or anything reasonable, and see a comparison with corresponding days during the pandemic and pre-pandemic. We can make a map widget. We can sort any table column to see top/bottom stations.
What I don’t like about Superset and Tableau is, poor return on brain damage. They are no-code but you run into limitations when you can’t customize the design and filtering controls ad infinitum. Superset adds the pain of open-source projects, having to do detective work to figure out which requirements need to be pinned. You should be able to install it, point to a data source, import a dashboard, but it’s just not that simple. There is a lot of faffing around.
I also tried Plotly Dash. The issue with Plotly Dash is, it’s the opposite of no-code. You have to be a Python dev and Bootstrap web dev since the defaults might make you sad. There is way more brain damage than Superset, but also way more return on the brain damage, since you can control everything and get UX that’s only limited by what you can conceive of in React and Plotly.
Pick your poison (a first cut at a decision framework, not intended to be correct/complete):
| Feature | Tableau | PowerBI | Superset | Plotly Dash | Streamlit | Looker | Qlik | Grafana |
|---|---|---|---|---|---|---|---|---|
| No-code | ✓ | ✓ | ✓ | ❌ | ||||
| Looks great out of the box | ✓ | ✓ | ✓ | ❌ | ✓ | |||
| Roll your own complex custom visualizations | ❌ | ✓ | ||||||
| Rich UX controls and widgets | ❌ | ✓ | ✓ | |||||
| Connect to many DBs | ✓ | ✓ | ||||||
| Real-time w/streaming APIs | ✓ | ✓ | ✓ |
7. Wrapup
Some additional things we might do:
-
Dagster for data download and ingestion. Airflow is the 500lb gorilla of DAG scheduling, but probably more complex/less modern. (Might be a Sendmail vs. Postfix situation if that analogy means anything to you). We would like a layer that senses when remote data is available and runs the ELT, or runs it on a schedule, and lets us monitor the pipeline. Ours is such a simple pipeline that the full Dagster template is overkill and the simplest Dagster template doesn’t exercise Dagster. Prefect, Mage are other options. These are all open source with a paid cloud offering. I can’t tell which of the new alternatives will get traction and have a real open-source community. There is potential for lock-in if you back the wrong horse and the primary developer limits features outside the paid version.
-
Productionize the data stack-in-a-box. We can make a Dockerfile with installs of DuckDB, dbt, Superset, and other tools. Then run the pipeline in the container, test it, and when it looks good, push a container running Superset to AWS Elastic Container Service or Google Cloud Run, and that’s our data product. Now, by the time I got everything in there that I wanted, it became a 20GB image and that’s not the right way to use Docker. Ideally, you also want to be able to push new data and software updates without taking the service offline and moving it to a new container. And you want to make the service auto-scale and automatically spin up and load-balance new containers when it’s busy, which needs the front end to be stateless or load-balance intelligently. Here single-user DuckDB becomes limiting, it doesn’t scale gracefully to real-time multi-user updates, or larger-than-memory no-BS real ‘big data’.
-
Use Spark for the ELT.
-
Meltano is a CLI to manage data pipelines, that can ingest data via Singer taps and Airbyte connectors that talk to most SaaS services. It’s the closest thing I’ve seen to an API of all APIs. I implemented it for the MTA data but it was much slower than native DuckDB ingestion.
-
Great Expectations data quality. I have a rule to throw out turnstiles with more than a threshold of 2000 entries in a measurement period, or turnstile median+4SDs, whichever is greater. Because while 2000 entries per turnstile seems like a reasonable upper bound, there are stations like Bedford St L where the line for the turnstiles backs up through the morning rush hour (or at least did pre-pandemic). More sophisticated statistical and ML-driven DQ might detect possible maintenance-related data issues with higher precision and recall. The data quality issues here can be challenging. It’s easy for a turnstile to go from dozens of entries to hundreds if for instance an entrance is shut down and people are redirected, game day at Shea, concert at the Prospect Park bandshell. Insight into the real-world process and shoe leather tracking down process issues is inevitably the biggest part of the data quality function. And you have to do a reasonable amount of work relative to the benefit. If you are predicting overall system usage, then odd data from one turnstile may not matter, if you are redesigning a station then it might be telling you something important.
-
This stack addresses fast analytical queries, but real-time low-latency streaming dashboards are another can of worms. (Superset connects to real-time Apache Druid.)
-
Data governance, a firmwide global ‘library catalog’ like Amundsen or DataHub, and processes to ensure regulatory compliance. Beyond the scope of a data stack-in-a-box.
A stack of DW/dbt/Dagster/Plotly Dash is an excellent starting point. We are blessed and cursed to live in interesting times; putting all these pieces together, building UI and deploying scalable apps is still quite a lot harder than it should be. In particular, the steps to deploy an app or dashboard could be easier. I can hardly fault people for sticking with SQL Server, Power BI, and some web apps. Google, Microsoft, and Amazon seem to be throwing a lot of spaghetti at a lot of walls in the cloud.4 Maybe in the not-too-distant future a big data pipeline deployed to a dashboard will be no more of a big deal than Excel. Maybe there will be SaaS data warehouse services where all you have to do is tell it which SaaS you use to run your business, and it connects to each one and builds a custom modern data warehouse. It will be interesting to see what happens.
This endeth my initial foray into modern data engineering. It’s quite a rabbit hole. This is one of those posts you publish out of exhaustion rather than satisfaction in the end-result. There may be future in-place updates.
A running dashboard is here.
In the meantime, may all your pipelines be unclogged!
The Bongos: Numbers With Wings
-
Unstructured image, video, and audio data are different matters. ↩
-
Part of me feels like, if you’re a relational database, you had one job, provide a robust, performant abstraction to tabular data. It feels code-smelly to have to use a totally different RDBMS engine for column-oriented vs row-oriented. SQL Server has had COLUMNSTORE for 10 years, even if some really big data folks may not consider it a true data warehouse. Maybe the traditional RDBMS will incorporate better column-oriented functionality and keep all the good stuff like transactions and query optimization. Or maybe everyone will have to query a plethora of database engines and data lakes and we’ll need a SQL layer on top of them all to complicate our lives with federated joins and distributed transactions. Oy. Possibly that’s the niche that tools like Trino (f/k/a Presto) are looking to fill. Data seems like the mother of all leaky abstractions, you don’t get great performance if you don’t know a fair amount about what’s going on under the hood. Michael Stonebraker says we need best-in-class specialized engines and he invented a large chunk of the modern RDBMS so who am I to argue with him? (He has a good list of data blunders). DBAs and data engineers are maybe not going away. Or maybe it’s so hard that a lot of people will just put the data into SaaS solutions optimized for their use case. ↩
-
If I was writing the article (maybe I will if I don’t find a good one), I would benchmark vanilla pandas, Modin with different back-ends as an (almost) drop-in replacement for pandas, DuckDB SQL, and Polars, which is a dataframe alternative for pandas written in Rust and using the Arrow in-memory dataframe data structure. Maybe R too. ↩
-
Google with Looker and Google Sheets connecting to BigQuery, Apigee, Cloud Scheduler, Cloud Run, Cloud Functions, PubSub has potential to become an integrated one-stop SMB platform. The Microsoft stack with Azure Data Factory orchestration, Synapse cloud SQL Server OLAP, PowerBI seems more BigCo oriented. AWS seems more a la carte but they have Step Function orchestration, AWS Glue ETL, Redshift and Athena data stores, Quicksight dashboards. ↩