Druce Vertes
Fractional Chief AI Officer / AI Advisor to Hedge Funds & Asset Managers
I help hedge funds and asset management firms plan and execute AI, and get projects out of the 80% trap and into production: RAG research, text-to-SQL on CRM data, and agent workflows that survive real-world market conditions.
Thirty years as a front-office quantitative analyst, hedge fund CTO, and hands-on AI builder, including work at Tiger Management, Caxton, and as CTO of a $2B Tiger Cub fund.
Recent work
- Designing and deploying RAG-based research summarization, text-to-SQL on CRM data, and agentic workflows for sell-side and buy-side teams.
- Architecting agent automation systems using OpenAI Agents SDK and LangGraph.
- Traditional ML for alternative data signals.
Background
As CTO of Hoplite Capital Management (2008–2010), I was the first internal tech hire at a 25-person, $2B AUM long/short equity fund. I built a best-practice end-to-end platform: OMS (Eze Castle), real-time P&L and portfolio analytics, FIX trading, compliance, post-trade workflows, and disaster recovery, supporting daily decision-making for PMs and analysts.
Earlier, I led hedge fund implementations at Charles River Development and held front-office roles at Caxton and Tiger Management. I began my career at Salomon Brothers, doing economic forecasting and building portfolio optimization systems using multi-factor risk models. CFA charter awarded 2009 (inactive).
Technical focus: Python, agentic systems, AI-assisted agentic SDLC, Claude Code / Cowork, LangChain / LangGraph, OpenAI Agents SDK, RAG, robust data pipelines.
The 80% Trap
Many AI projects fail successfully: they succeed as demos and POCs, then hit roadblocks when scaling to production or integrating with existing systems. Why? Common patterns include:
- Missing business-centric framing and success metrics.
- End-user or executive buy-in is lacking, or expectations misaligned with what the system can deliver.
- Inadequate observability, or lack of realistic evaluation against business objectives.
- Automating too little or too much, with poorly tuned human-in-the-loop dynamics that require constant babysitting.
- Governance, risk, and compliance blind spots.
- Agent POCs stuck in the messy middle, where they work 80% of the time but not in the high 90s production demands.
Get in touch
Download résumé (PDF)Projects
Experiments and learning projects in machine learning, data visualization, finance, and web development.
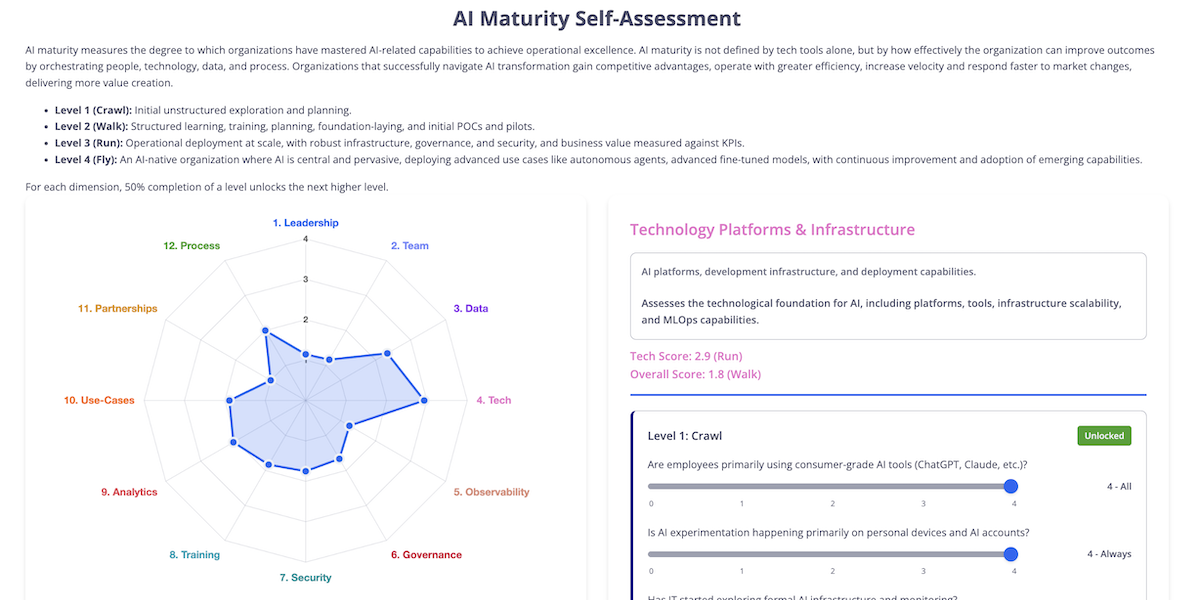
AI maturity self-assessment framework
Level 1 (Crawl): Initial unstructured exploration and planning.
Level 2 (Walk): Structured learning, training, planning, foundation-laying, and initial POCs and pilots.
Level 3 (Run): Operational deployment at scale, with robust infrastructure, governance, and security, and business value measured against KPIs.
Level 4 (Fly): An AI-native organization where AI is central and pervasive, deploying advanced use cases like autonomous agents, advanced fine-tuned models, with continuous improvement and adoption of emerging capabilities.
This self-assessment lets a firm score where they stand today, and inventories the steps most firms take to move up a level.
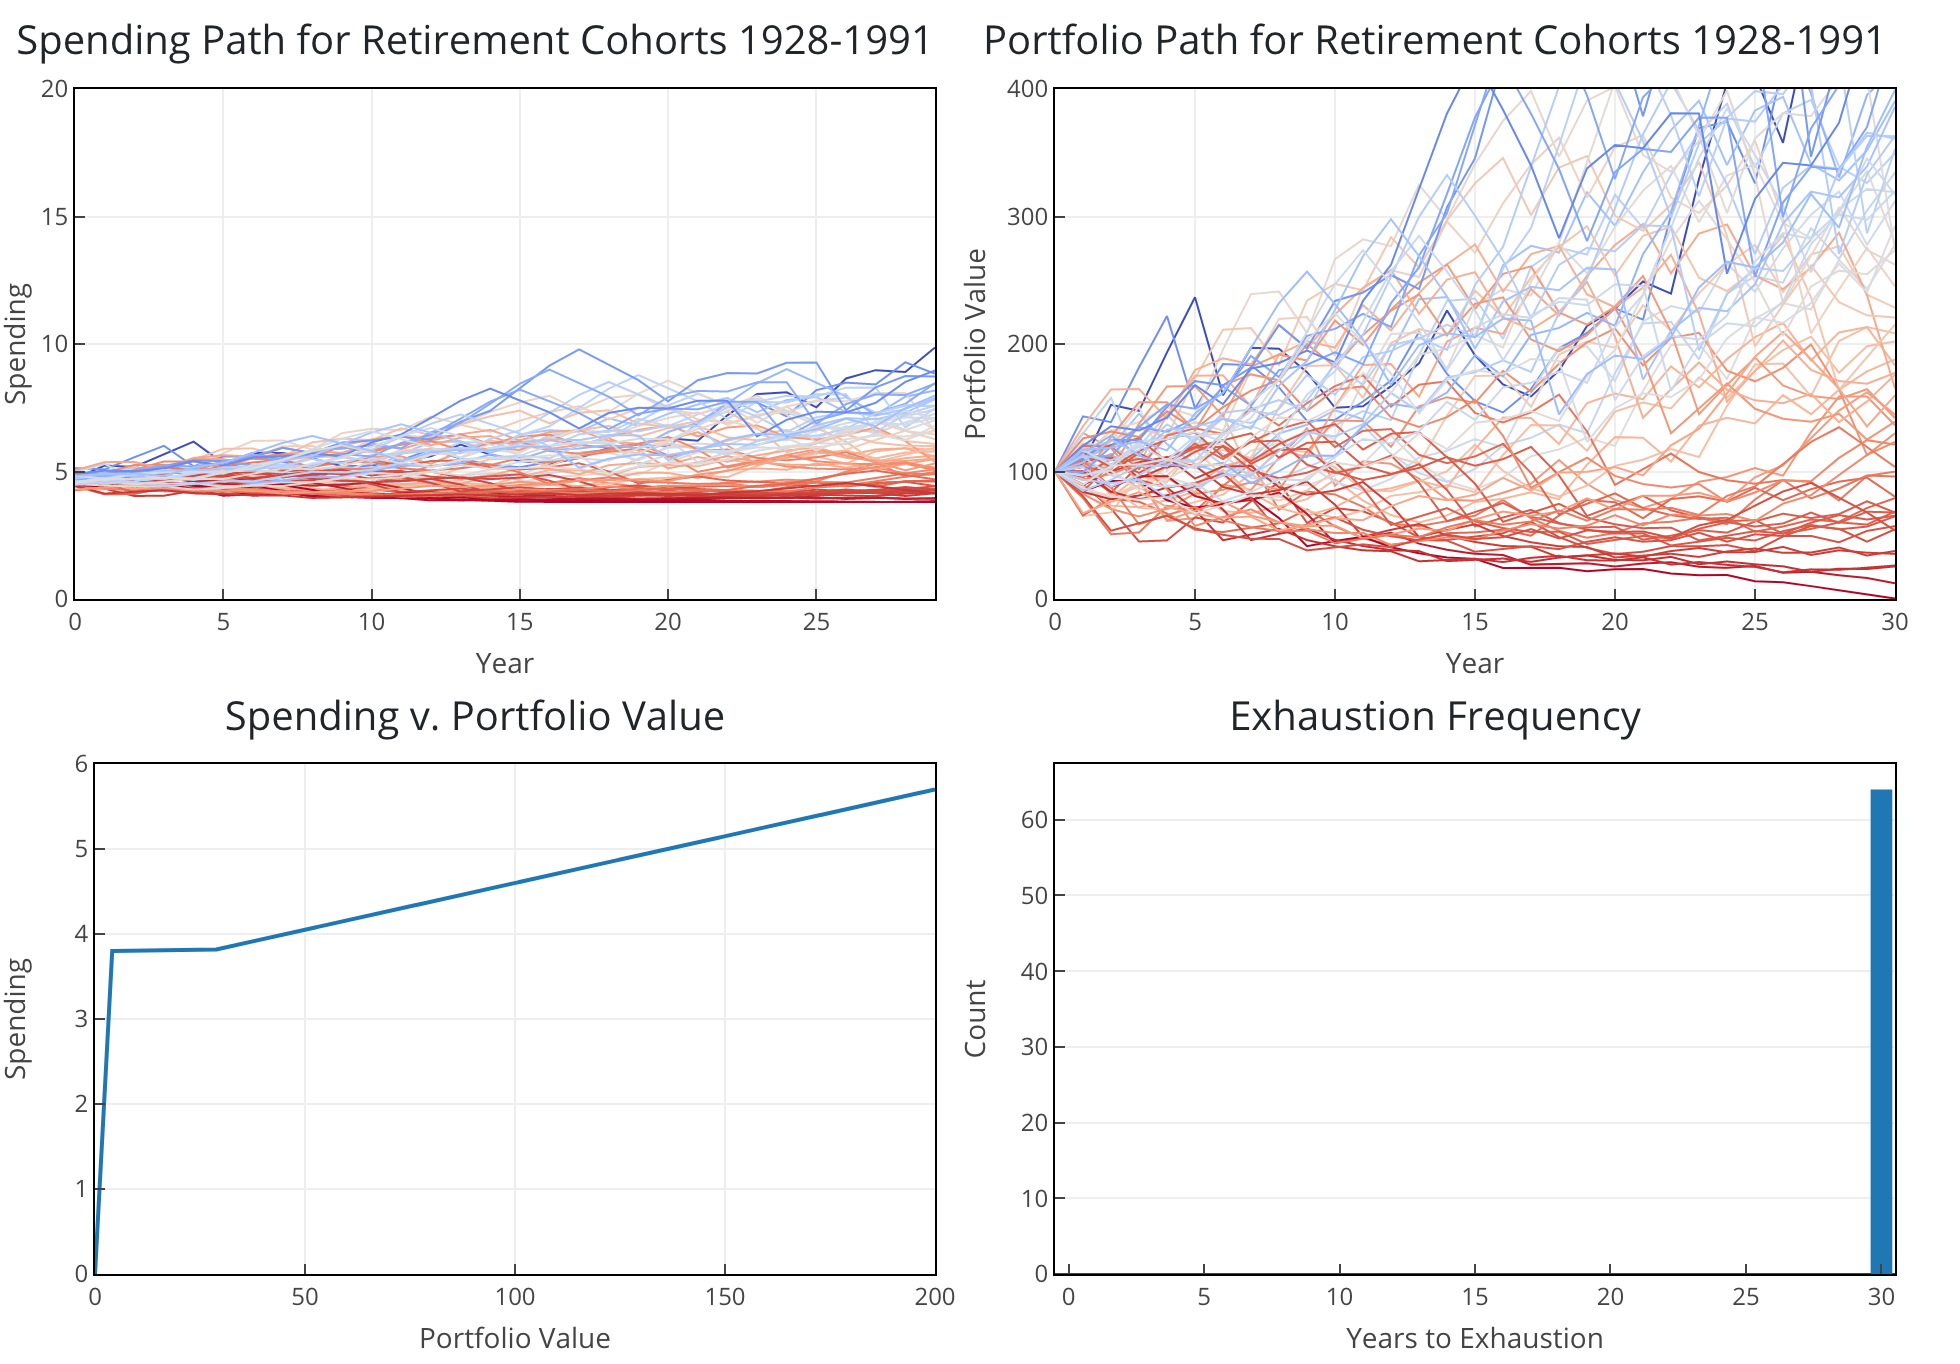
Safe Withdrawal Retirement Calculator
The rule emerges from optimization under a hard constraint that never allows withdrawals to decrease or the portfolio to run dry: an infinite risk aversion solution.
But what if we relaxed that constraint? What flexible rules would emerge at different levels of risk tolerance? A possible soft optimization objective is certainty-equivalent spending under constant relative risk aversion (CRRA): actual spending discounted by its volatility based on your risk preference. In a March 2021 article for Advisor Perspectives, I used gradient-free Python optimization on historical data to maximize certainty-equivalent spending and generate rules of the form:
Withdraw = fixed_pct + (variable_pct × portfolio_value), subject to a floor_pct minimum
As risk aversion increases, stock allocation decreases and the withdrawal rule shifts from variable to fixed. This framework lets retirees choose their preferred point on the risk-return spectrum, potentially tolerating some risk of future modest declines in spending for higher current and expected lifetime spending.
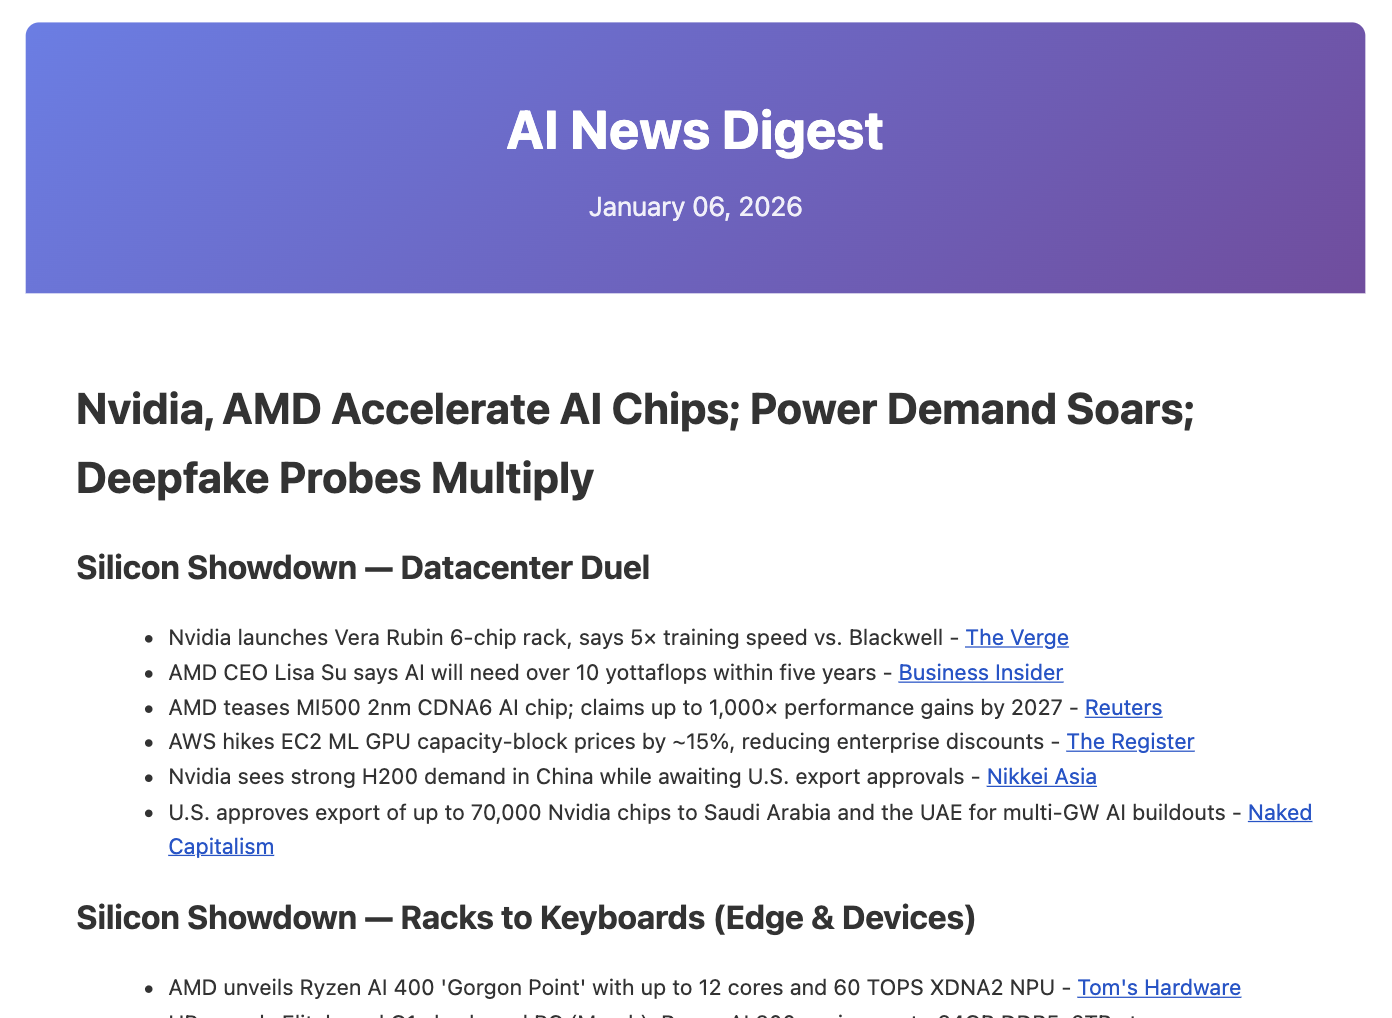
Agentic Newsletter Generation System
A 9-step pipeline runs web scraping, initial filtering, summarizing, deduping, reranking, semantic clustering, and critic-optimizer refinement.
~650 articles in, 30+ curated stories out across 7-15 thematic sections, with a 1,200-word draft ready for human editing in ~30 minutes.
Tech Stack: Python • OpenAI Agents SDK • GPT-4o (logprobs) / GPT-5 • Langfuse prompt repository/observability • Playwright web scraping • Pandas data wrangling • HDBSCAN clustering • UMAP dimensionality reduction • Pydantic structured output • SQLite database
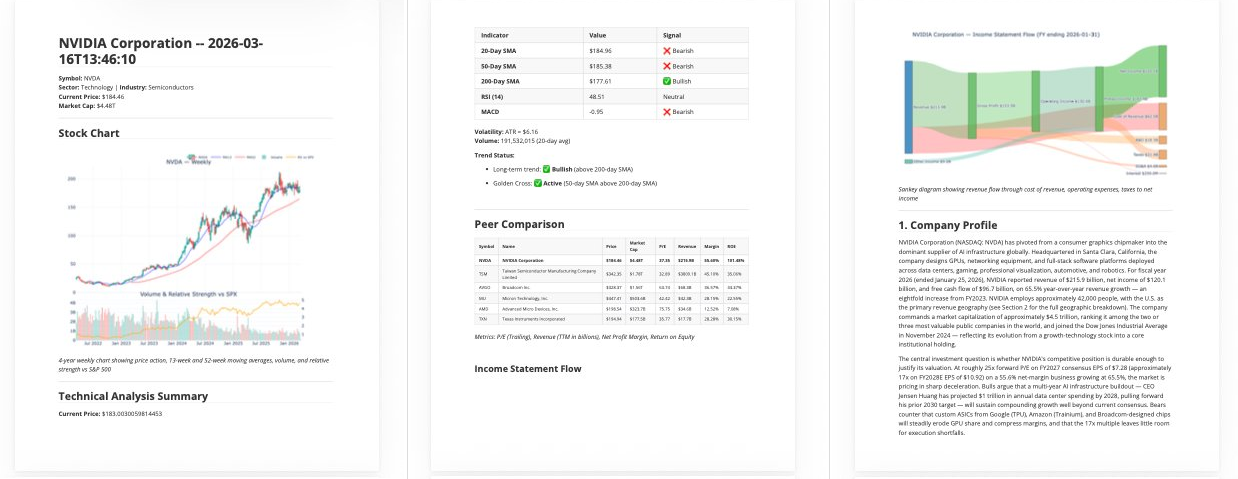
Stock Research Agent
./research.py NVDA produces a full markdown/HTML/PDF report via a steerable research and report-writing pipeline powered by Claude Code.The full generation steps and dependencies are defined as a directed acyclic graph (DAG) for repeatability. Runs ~33 tasks in dependency order: Python scripts gather company profile, financials, SEC filings, technical indicators, Wikipedia, and custom research questions; text artifacts are chunked, embedded, and stored in a LanceDB hybrid (vector + BM25) index, tagged by section; 7 research agents run in parallel via MCP, with findings flowing back into the shared index so each agent builds on the others' work; 7 section writers then run in parallel through critic-rewrite loops; sections are assembled with intro and conclusion, polished through a final critique pass, and rendered via Jinja2 and pandoc.
Enhances the Claude for Financial Services equity research plugin by splitting prompts per section, adding deterministic DAG flow with hard quality gates, LanceDB RAG, and critic-optimizer loops. Example output: NVDA, March 2026.
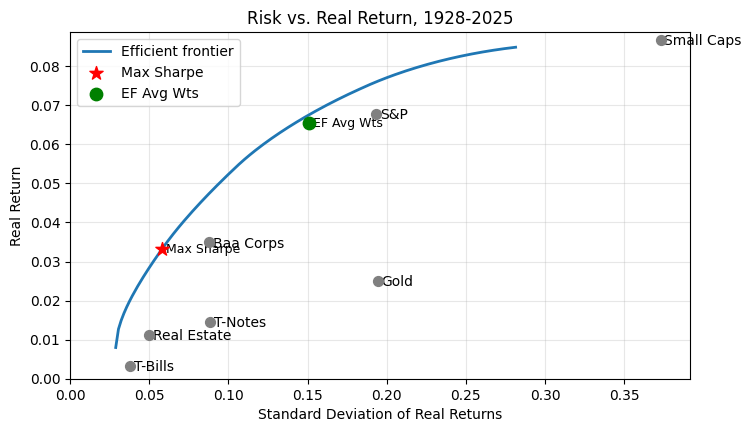
Portfolio Optimization
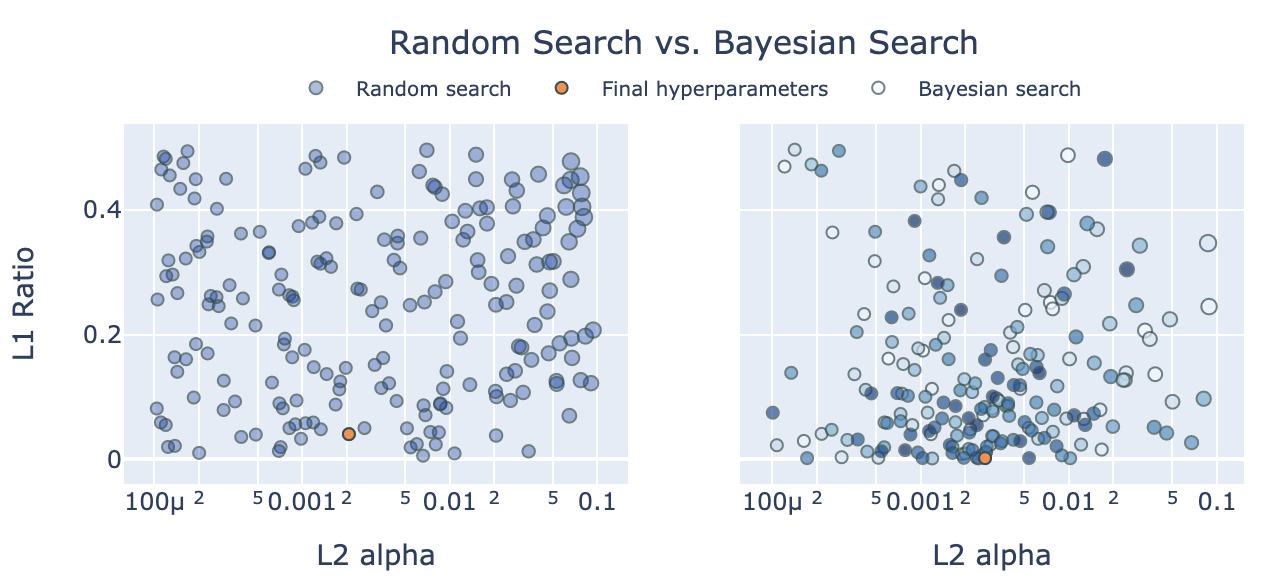
Hyperparameter Tuning
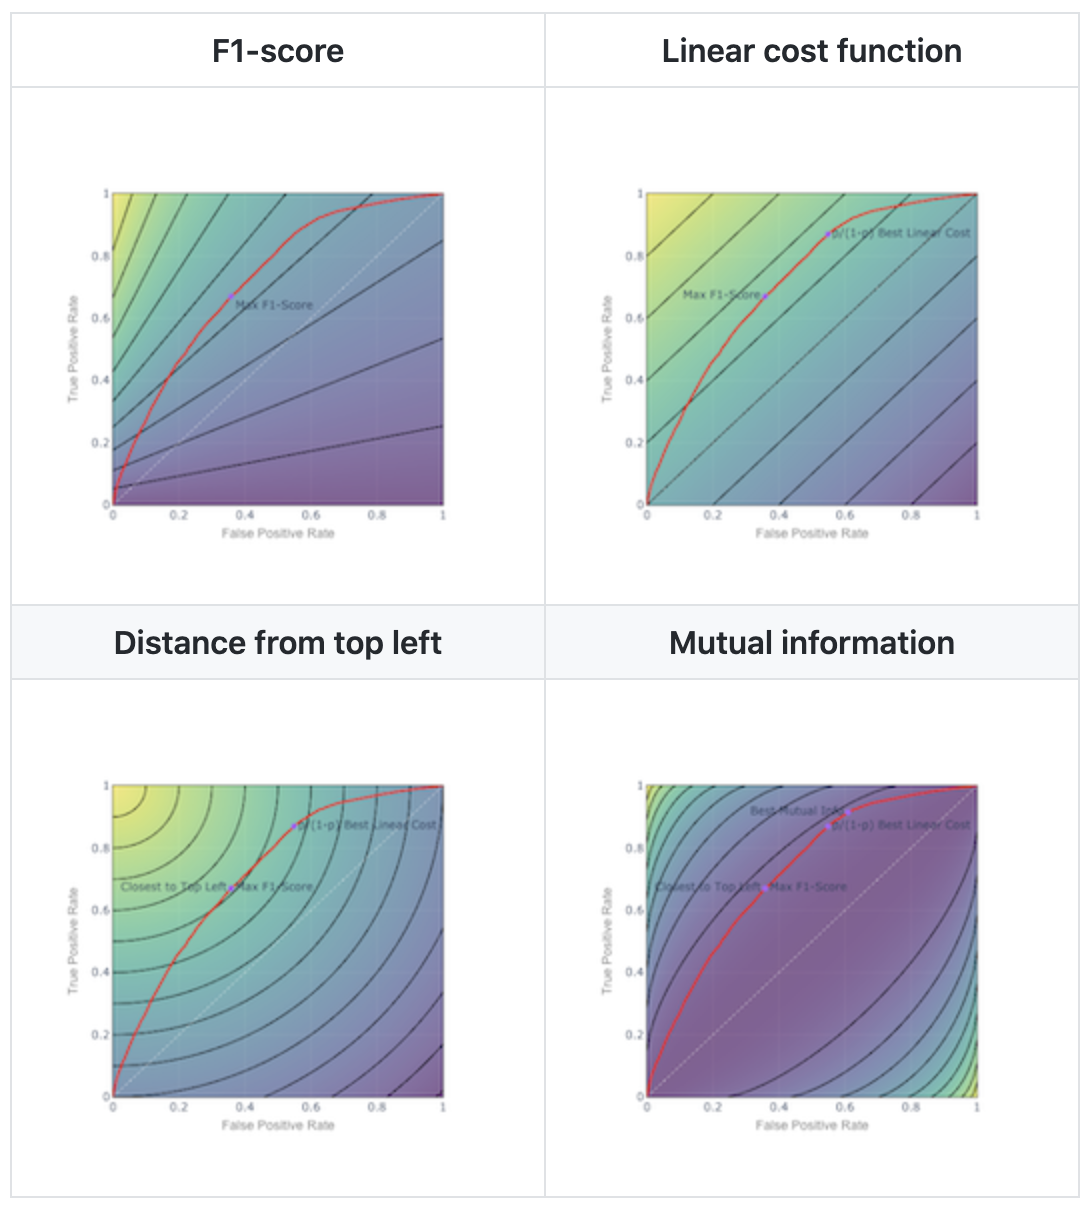
Classification Thresholds
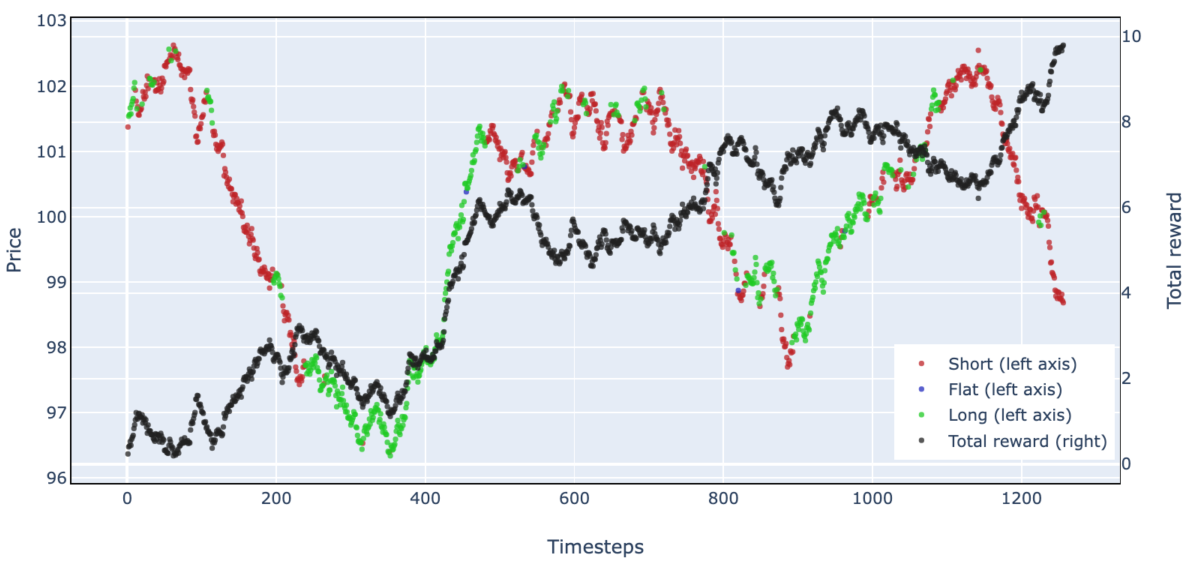
Deep Reinforcement Learning for Trading
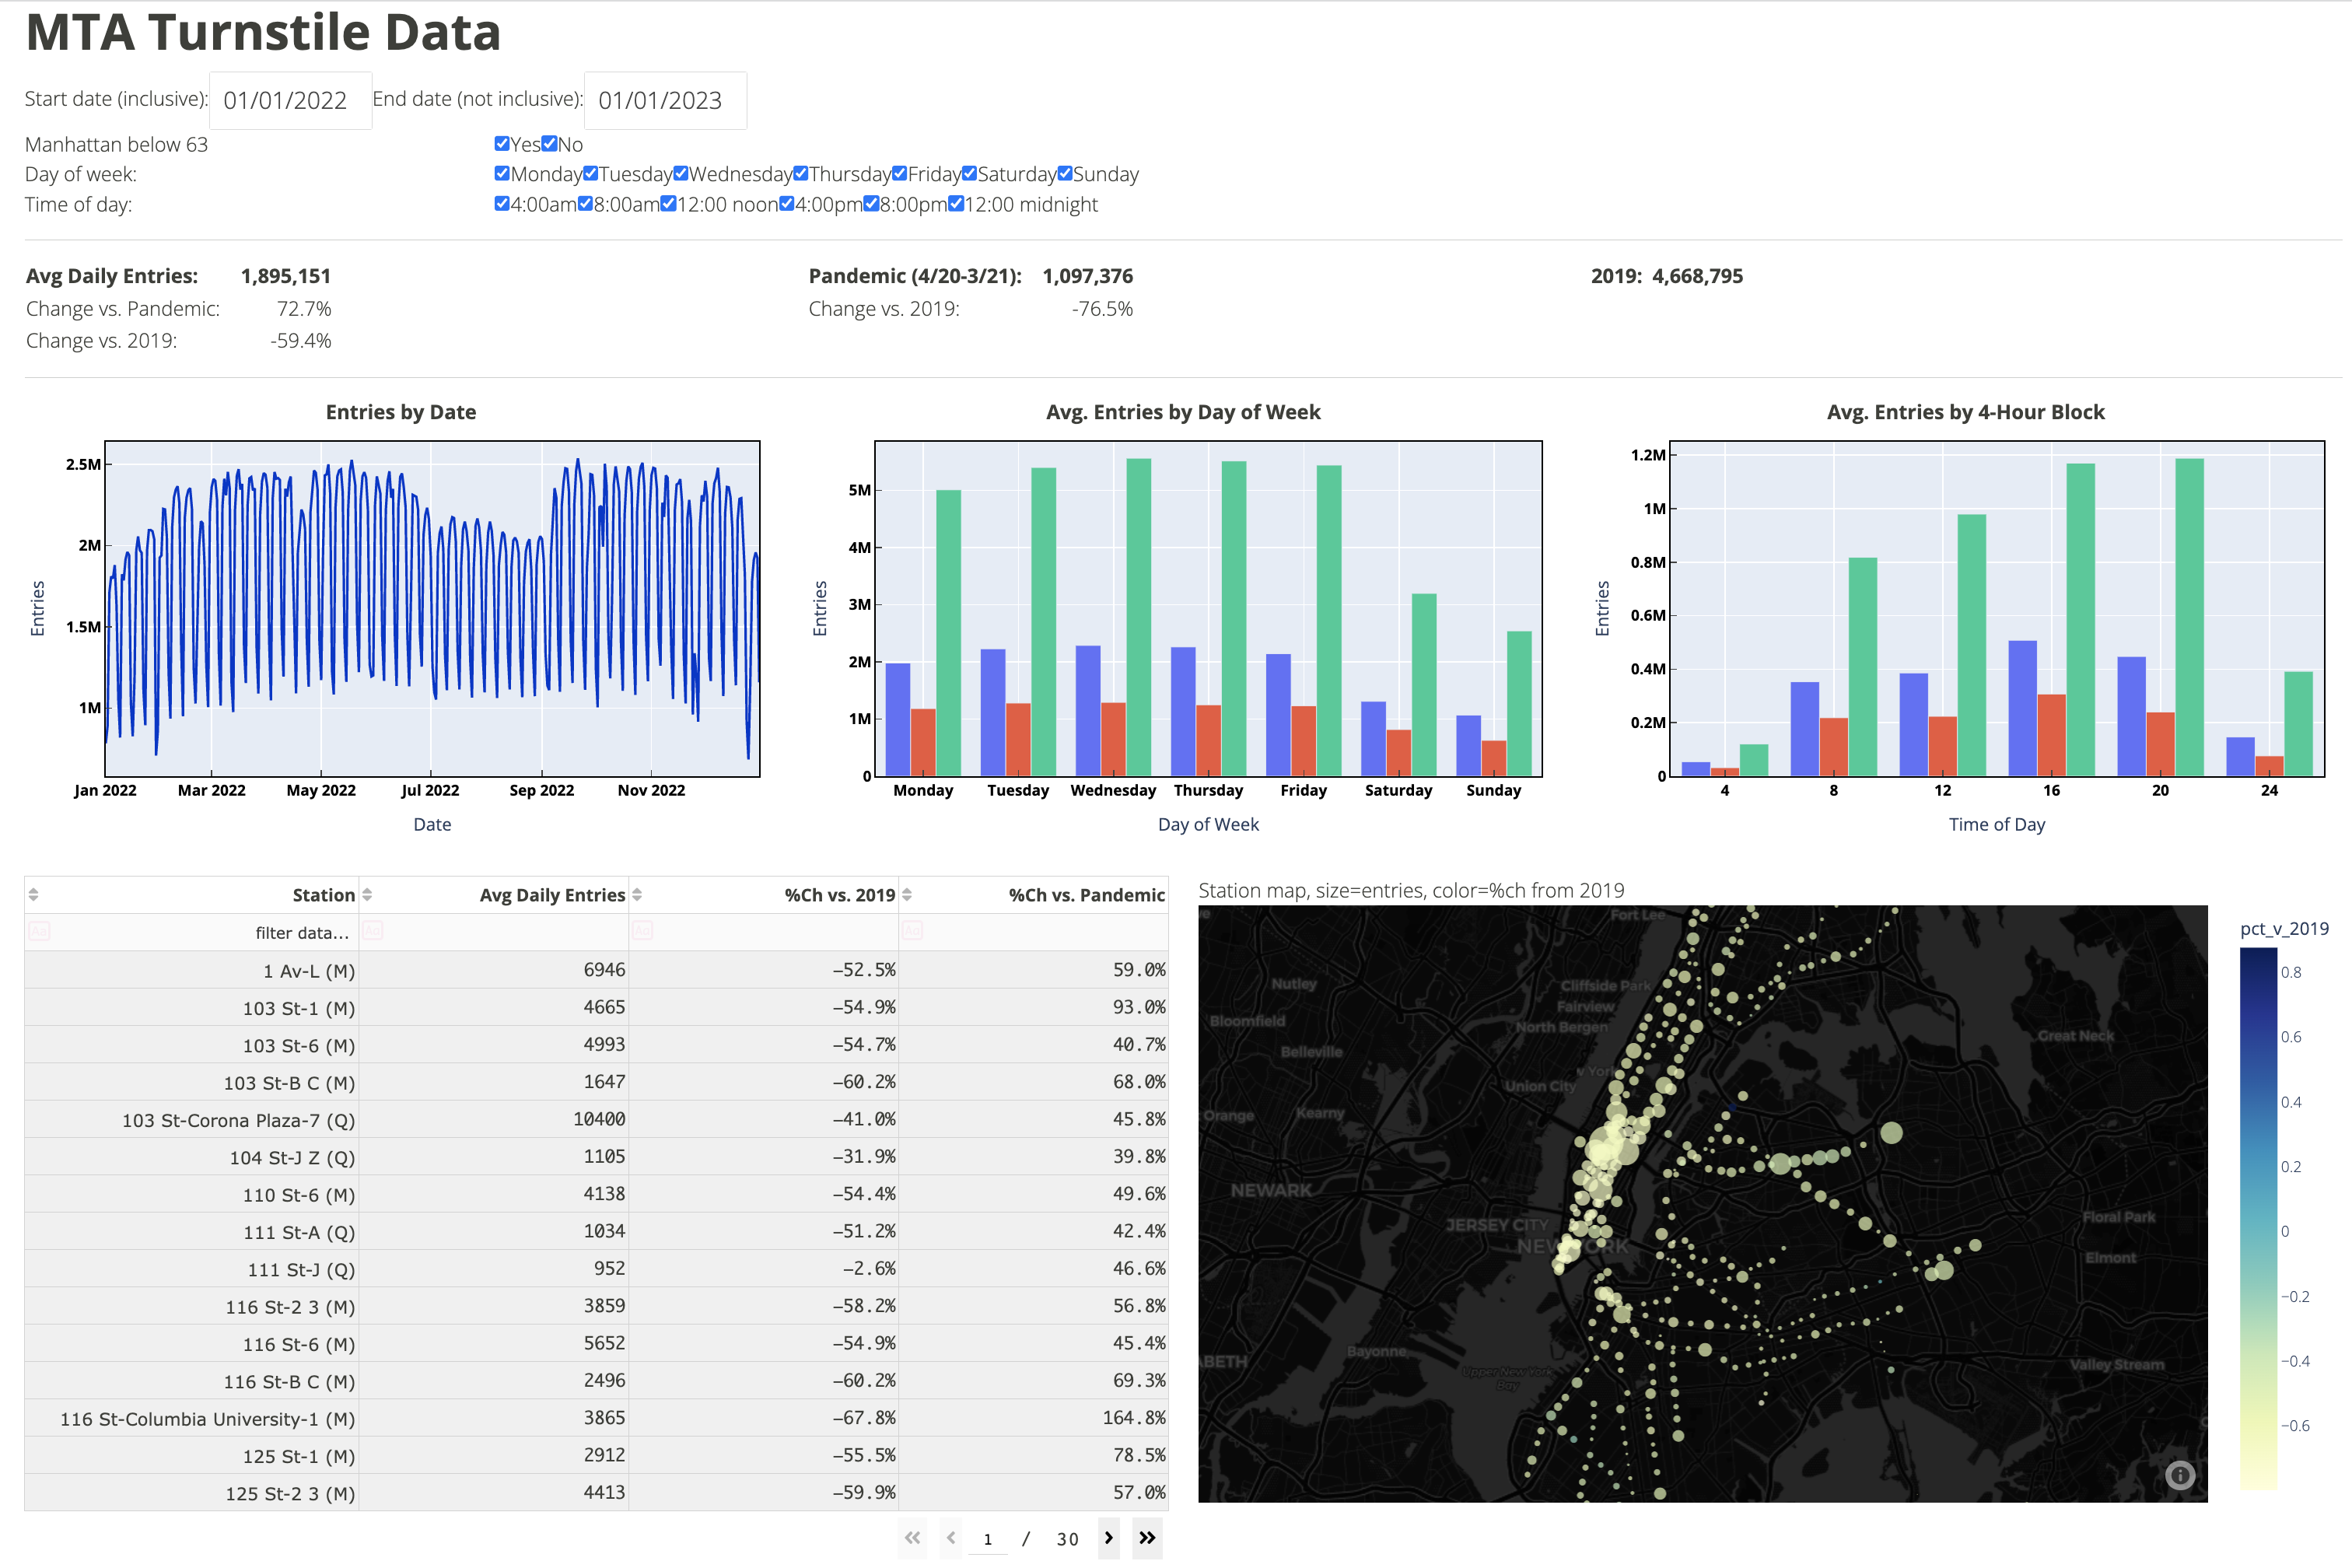
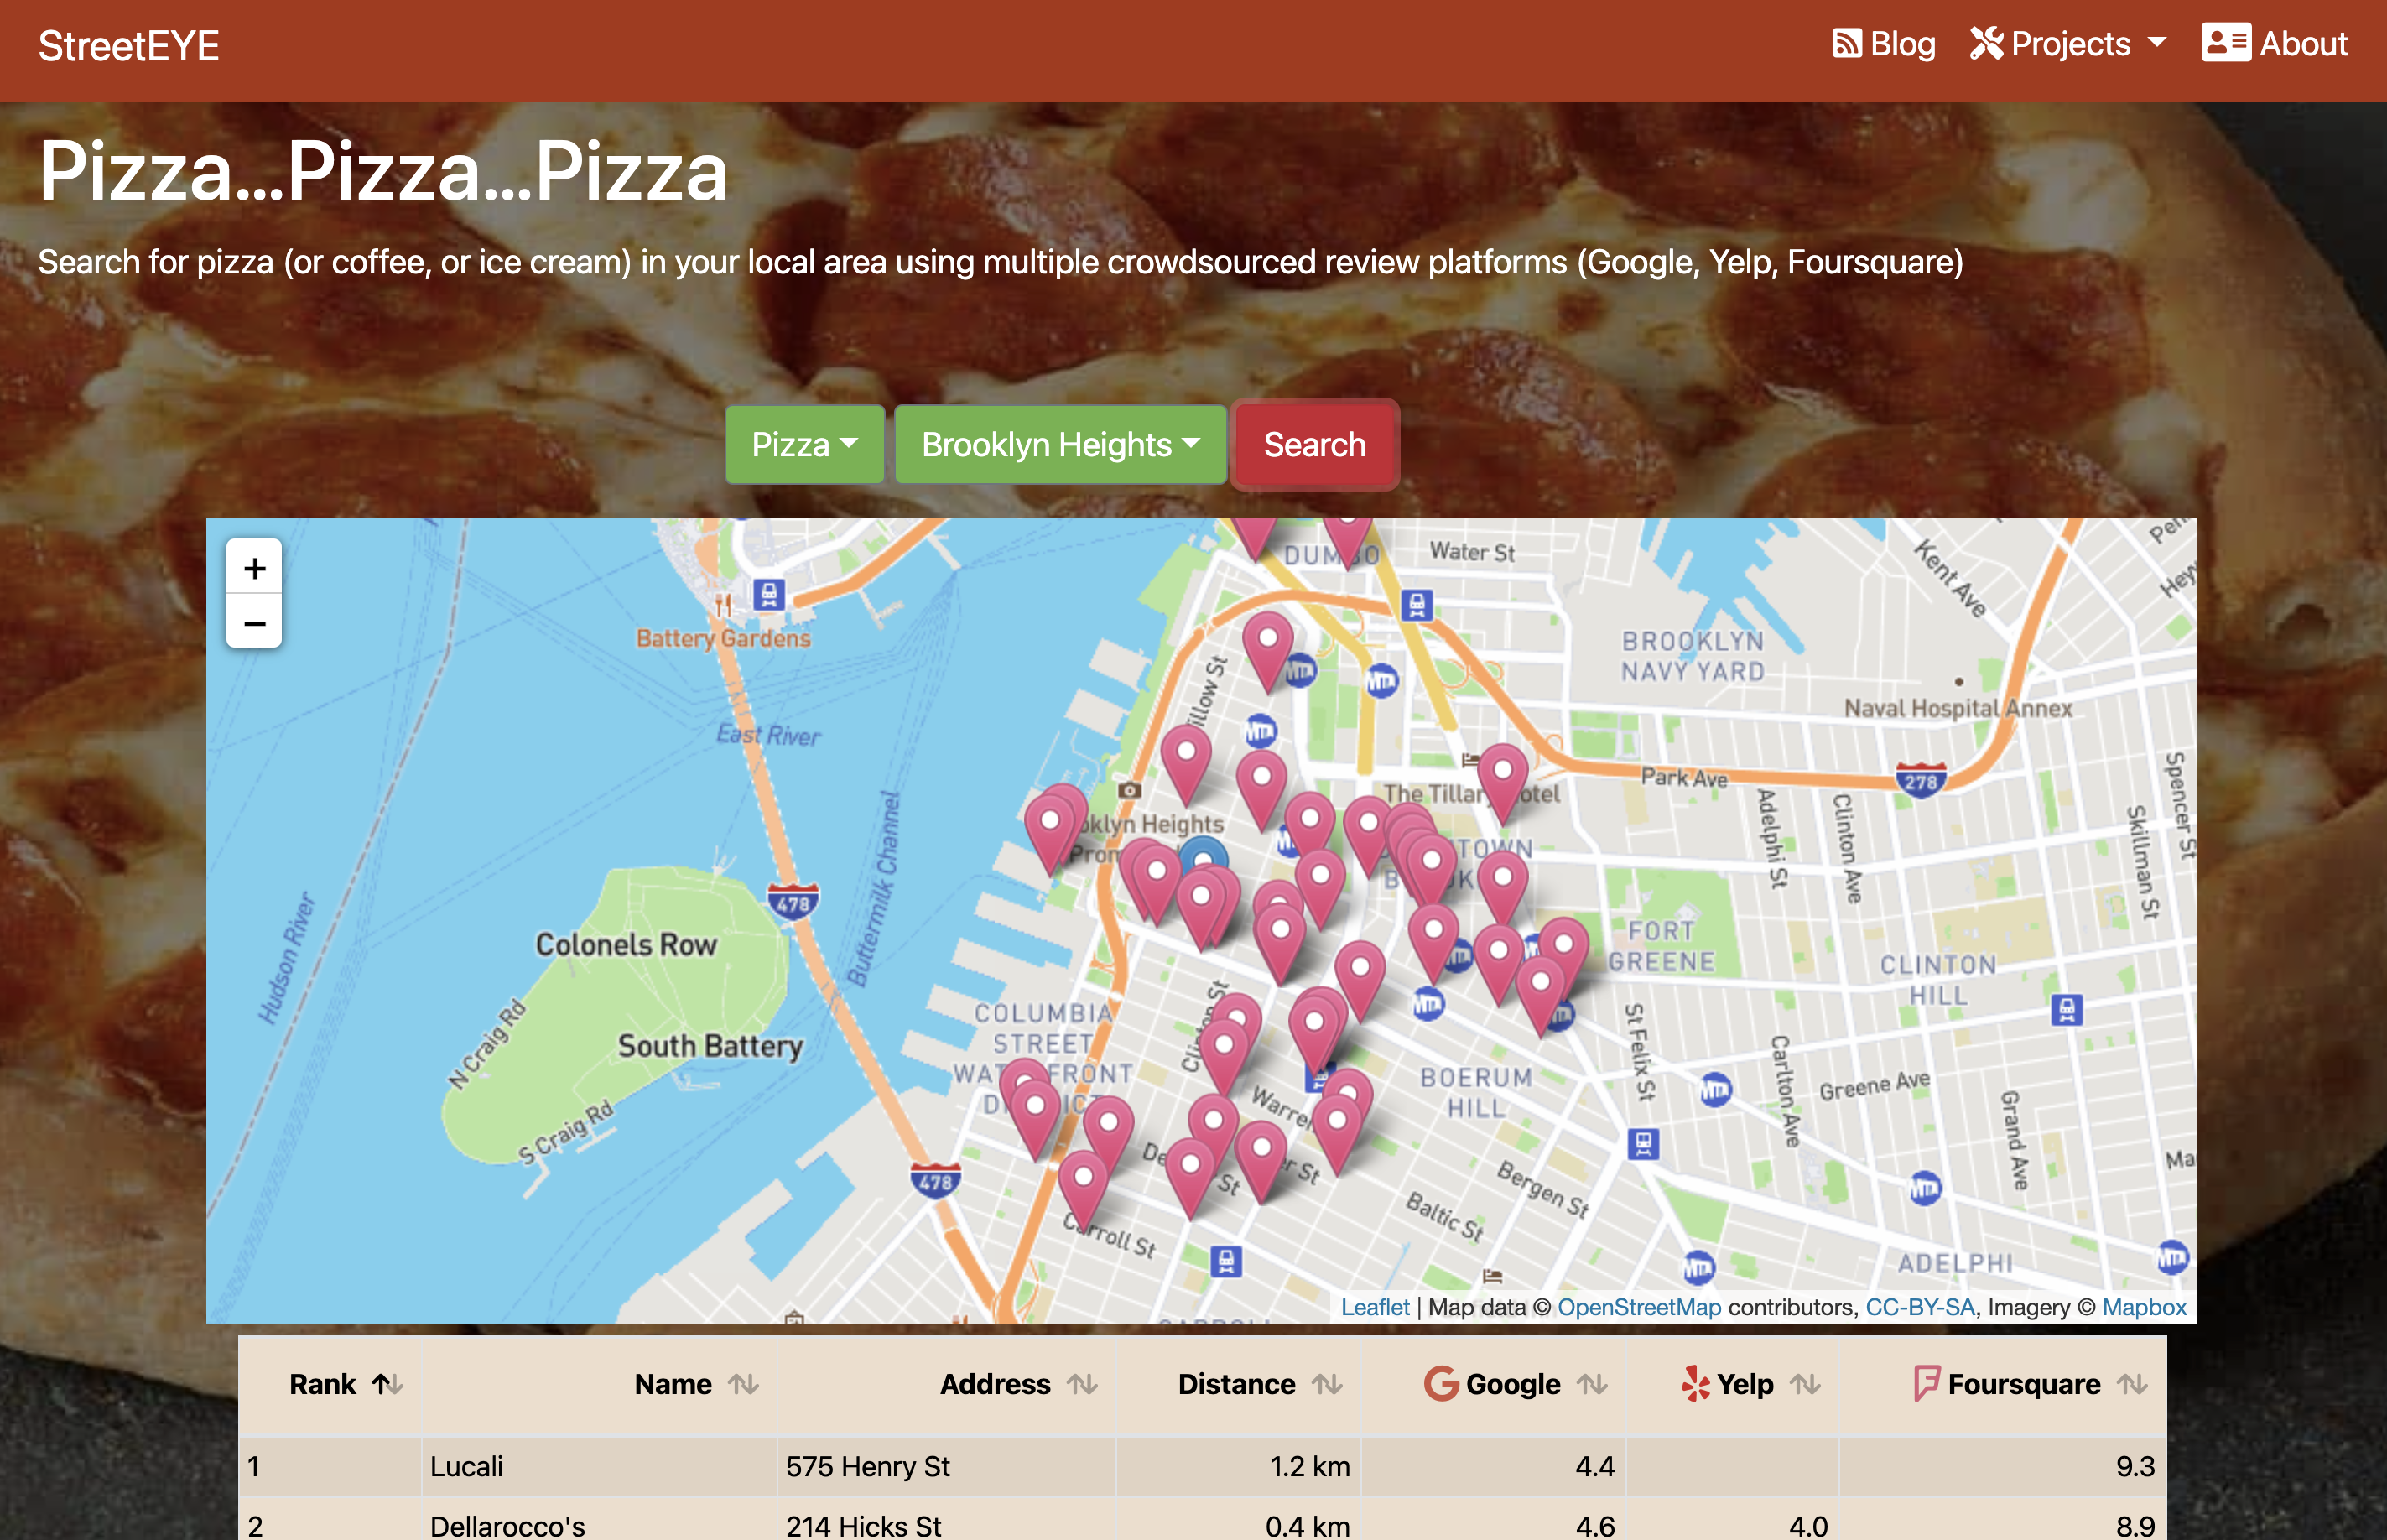
NYC Subway Dashboard