‘Cat Food’ In An Age of Diminished Expectations
Tucked away in the neglected items in the ‘Tools’ menu above, you might have noticed the metaphorical ‘Cat Food Calculator’.
The name may not be totally tongue-in-cheek in our world of neglected defined-contribution plans, depleted by poor performance and post-crisis raids.
The idea is pretty simple:
- input a portfolio value, asset allocation and withdrawal amount;
- imagine you retired with that portfolio in every year since 1928;
- apply the real withdrawal amount and the real returns experienced by that portfolio in each year;
- and determine in how many retirement ‘vintages’ someone who did that would have run out of money before dying (and possibly had to live on cat food).

Seemed like a pretty obvious thought experiment at the time. I was reading a recent Morningstar report by Christine Benz on how to plan for an inflation-adjusted retirement, and she referred to what she called a landmark 1994 article by William Bengen on the subject. I gave myself a little pat on the back after reading it and seeing that it used the same methodology.
A few things jumped out:
- The Bengen paper concludes a 4% withdrawal from the initial portfolio, increased annually to keep pace with inflation, was safe over all 50-year time horizons.
- This doesn’t match what I found with the Cat Food Calculator. Poor market performance subsequent to the period covered by the original report would have led to shortfalls for some vintages withdrawing at 4%, with any asset allocation.
- The report methodology doesn’t include fund expenses and taxes. These could be significant for people who aren’t fortunate enough to have all their funds in tax-advantaged accounts and don’t manage their own portfolio.
- Just looking at current interest rates makes it pretty obvious that bond returns can’t match their historical rate for the near future.
- Given recent volatility of financial markets, unsustainable trade and fiscal imbalances, and monetary policies that are extreme by historical standards, one suspects that a margin of error needs to built in to offset the risk that the environment for future returns, taxes, and inflation might be significantly less favorable than in the past, and even require alternative asset classes.
- In addition, a margin of error for unexpected expenses, including medical expenses, needs to be built in.
- On the other hand, the 50-year time horizon in the report is longer than most retirements are likely to be. Combining the returns with life expectancy data, which I tried to do, you can come up with a measure of how likely an investor is to outlive their portfolio. If a portfolio works in 95% of cases, and the 5% occur after the age of 90, it might be safe enough for a lot of people, especially if they have a fallback _ relatives, Uncle Sam, or Dr. Kevorkian. (j/k, Grandma!) (Also, life annuities can cushion the risk of cat food, giving a higher withdrawal rate but giving up bequest upside)
Here are three heatmaps that highlight the withdrawal rate sweetspot.
The first one maps % of shortfalls within 40 years. If you want to be in a regime that has never had a shortfall in the first 40 years, stick to a withdrawal rate and equity percentage in the darkest green area, for instance 3.3% with 50/50 equity/bonds.

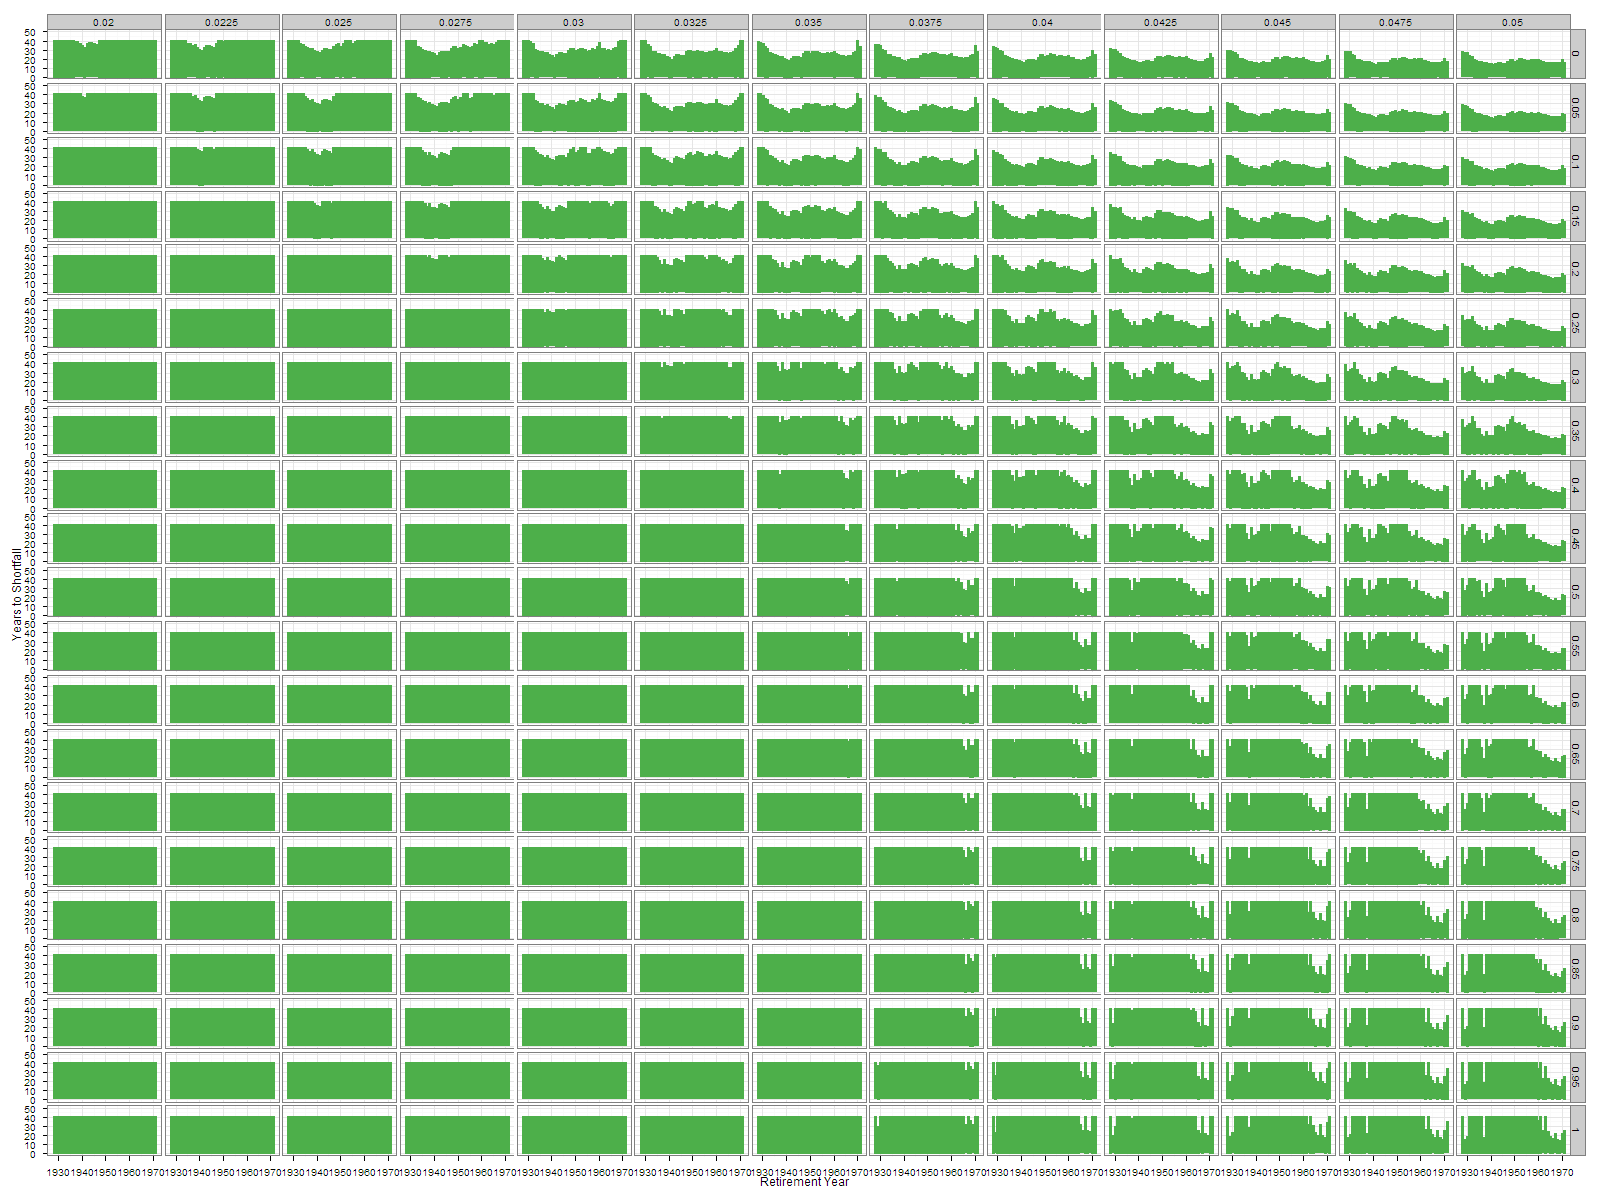
The second map shows historical years to the first shortfall. One takeaway is that when you stray outside the areas that have never seen a historical shortfall, the shortfalls don’t show up for 25-30 years if you don’t stray far. For instance, 50/50 bonds and 3.5% only led to 2 shortfalls in 44 simulations, after 35 and 38 years respectively. Shortfalls were not very probable, and happened late, so if you retire at 65, you are very unlikely to outlive your funds.

Finally, this puts the two together and uses Social Security life expectancy data to combine the probability of shortfalls with a 65-year-old male’s survival profile, to map the joint probability of ending up alive and experiencing a shortfall.

While the last map is more reassuring, the bottom line is that I don’t think the Bengen 4% rule holds up in an ironclad way, either on its own terms, or internationally and over longer time horizons than the original report. Looking at the maps or the underlying histories using withdrawal rates from 2% to 5% and equities allocations from 0 to 100% suggests 3.5%, less expenses, taxes and a margin of error, has historically been predominantly shortfall-free in the US, and more equities is better. So that might be ‘safe’ if the future is not significantly worse than the past.
Will review more literature, fine-tune the Cat Food Calculator, and possibly report back.
(See the disclaimers and note that this is not investment advice)