Gold as Part of a Long-Run Asset Allocation
What does an efficient long-run portfolio look like for major US asset classes, and where does gold fit in?
Let’s take US annual stock, bond, T-bill, and gold returns for 1928-2010, and subtract CPI inflation to get real returns.
| Real Return | Real Risk | |||
| Stocks | 8.1% | 20.1% | ||
| Bonds | 2.1% | 9.1% | ||
| Bills | 0.5% | 4.1% | ||
| Gold | 1.7% | 15.8% | ||
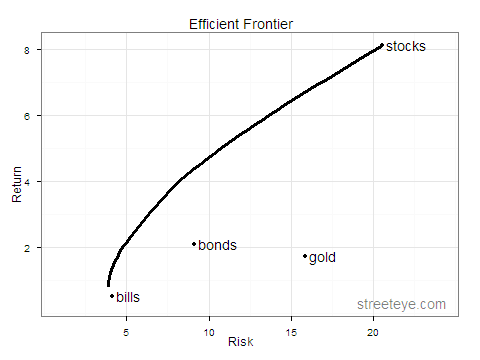
Let’s plot an efficient frontier. This shows the highest return you could achieve with those four assets over those 83 years at different levels of risk.
| Real Return | Real Risk | |||
|
4% real return portfolio (34% stocks, 44% bonds, 22% gold) |
4.1% | 8.4% | ||
|
5% real return portfolio (49% stocks, 32% bonds, 19% gold) |
5.0% | 10.7% |
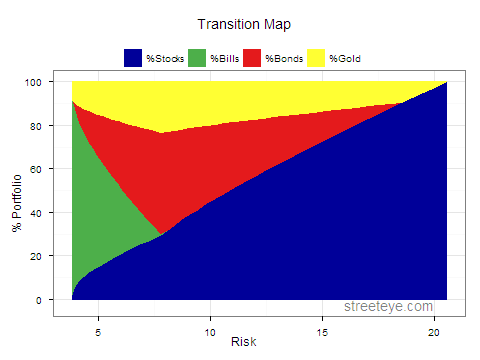
Let’s plot a transition map. As you move from low risk to high risk left to right, it shows you the composition of the best-performing portfolio at that risk level, how much would be in each asset.
What does this tell us?
- For minimum real return risk, the best portfolio was mostly cash (bills), with a small amount of gold (and a smidgeon of stocks). This would have given a modest real return of 0.8%.
- For maximum real return, stocks were big winners.
- Gold had a modest real return in this period, which ended in 2010 with gold at 1225. In real terms gold performed better than bills and just behind bonds, and added value as a modest fraction of most optimal portfolios. Gold’s volatility was high, and is also understated since its price was pegged for more than half of this period (and Americans couldn’t legally hold it).
- TIPS only became available recently, so there isn’t enough history for this analysis, and they also have their place. (But with rates at and sometimes below zero, CPI basis risk, fees, taxes, they will only shine if there is inflation.)
While returns are adjusted for CPI inflation, they don’t reflect fees and taxes.
The analysis is based on this post at Systematic Investor, and the gold mine of R code generously shared there. Will post more technical details, code, and some drill down analysis in coming days/weeks.
(A 2015 update also looking at how stable this relationship was over time.)

