Risk: Visualizing Diversification With Risk Triangles
In this post we’re going to look at a simple way to visualize the power of diversification, and what correlation really tells us.
Suppose you have 2 investments, A and B.
You create a portfolio that consists of 1 share of A, and 1 share of B.
How risky is the combined portfolio? It depends on how risky the individual securities are, and on the correlation of the two stocks’ returns.
Suppose the volatilities of A and B are
A: σA = 6%
B: σB = 8%
and
correlation: ρ = 0
What does correlation ρ = 0 mean?
ρ means, when A’s return deviates from its mean by 1 standard deviation or σA, the expected deviation of B’s return from its mean is ρ standard deviations or ρσB .
In this example, since ρ is 0, we don’t expect B to deviate from its mean in any systematic way.
So, how risky is the combined portfolio? The formula for the volatility of the portfolio is1:
![]()
In this example, ρ is 0, so the correlation term goes away, and you are left with:
![]()
Which looks kind of like the Pythagorean theorem, right?
And the general formula including the correlation term looks like the law of cosines, which is the generalization of the Pythagorean theorem to non-right angles:
![]()
Where γ is the angle between the 2 sides.
So, to represent 2 securities with ρ correlation, we can draw a triangle where
- The length of side 1 of the triangle represents the volatility of asset A: σA
- The length of side 2 of the triangle represents the volatility of asset B: σB
- The angle between sides 1 and 2 is the angle whose cosine equals -ρ, where ρ is the correlation of assets 1 and 2 (note the formulas are similar but the sign of the last term is reversed)
Figure 1: Risk Triangle, correlation = 0, cos 90° = 0
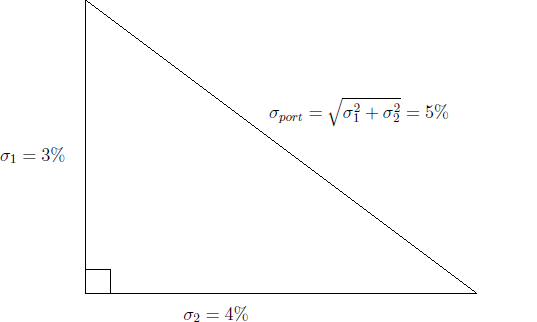
Figure 2: Risk Triangle, correlation = -0.5, cos 60° = +0.5**
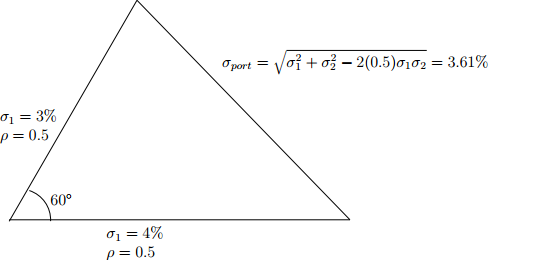
Figure 3: Risk Triangle, correlation = 0.5, cos 120° = -0.5
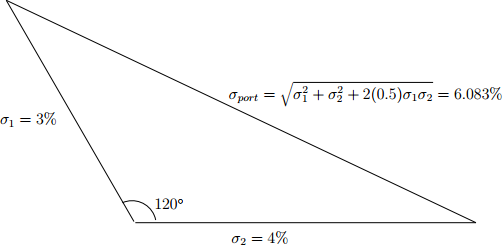
Figure 4: Table of portfolio vols for various correlations
|
Stock A Vol |
Stock A weight |
Stock A wted vol |
Stock B vol |
Stock B weight |
Stock B wted vol |
Correlation ρAB |
cos-1(-ρ) |
cos |
Portfolio Vol |
| 6% | 50% | 3% | 8% | 50% | 4% | 100% | 180° | -1 | 7% |
| 6% | 50% | 3% | 8% | 50% | 4% | 50% | 120° | -0.5% | 6.1% |
| 6% | 50% | 3% | 8% | 50% | 4% | 0 | 90° | 5% | |
| 6% | 50% | 3% | 8% | 50% | 4% | -50% | 60° | 0.50 | 3.6% |
| 6% | 50% | 3% | 8% | 50% | 4% | -100% | 0° | 1 | 1% |
Left as an exercise: draw the pictures for correlation = 1 and correlation = -1.
If you think visually, then these pictures can give you better intuition about what adding imperfectly correlated assets can do to your risk/reward.
All chance, direction, which thou canst not see;
All discord, harmony not understood;
All partial evil, universal good.” — Alexander Pope
</p>
Adendum _ more intuitions and speculations about correlation and risk.
- Diversification is, as Harry Markowitz said, one of the few free lunches in investing.
- If you can reliably find low-correlation or negatively correlated bets, you can chop risk or supercharge returns.
- Suppose you can find enough stocks that you can reliably expect to go down, to put 20% of your portfolio in short positions. Your market exposure just went down 20%, and your expected return went up! Alternatively, you could lever your stocks to 120% and go short 20%, keeping your market exposure at 100%, while levering long-term returns more than 20%. Of course, this is easier said than done, otherwise short-selling funds wouldn’t have such a low long-term survival rate, and hedge funds would consistently generate alpha and outperform the market.
- Ray Dalio: “If you get 15 good — don’t have to be great — uncorrelated return streams, you’ll improve your return to your risk by a factor of 5. That means 5 times the return for the same amount of risk.” Again, easier said than done! To find 5 uncorrelated return streams, that would mean that the ‘dimensionality’ of the return space isn’t 2 dimensions, like the triangles above, but at least 5. Is it?
- In the short run, and for small amounts of money, you can find a large number of uncorrelated things to bet on. You just need someone to take the other side of the bet. For the right price, Wall Street will make a market in almost anything legal. Of course only some of the bets have attractive, or even positive returns after fees. Nevertheless, anywhere there is someone who naturally is coming into a lot of risk, there is a decent chance they will be willing to pay a decent return to someone to unload or diversify that risk.
- But you don’t need your money in the short run. You need it at the end of your investment horizon. What matters isn’t the distribution of returns over time. What matters is the distribution of the range of potential returns at the end of your investment horizon. As discussed in the last post, volatility is a proxy for what the people in the market today think risk is, not what it really is.
- The longer time period you look at, the more things are cointegrated and the fewer dimensions the return space has. If the sun stops shining tomorrow or an asteroid strikes the earth, all your stocks and bonds are going to return the same thing, zero. Of course, we can’t evaluate the probability of such uncertain events, and if they happen, returns won’t make any difference to your outcome, so it’s reasonable to exclude them from the return distribution. The point is, when big historical regime shifts happen, things are more correlated than you think.
- Just as every form of energy in the economy comes or came at some point from the Sun, all income streams get paid out of GDP or national income. All the investment returns come from GDP.
- In the short run, in the current market regime, stocks and bonds are seen as good diversifiers, as changes in risk appetite drive people out of stocks and into bonds, and as good prospects for growth and inflation motivate investors to sell bonds and buy stocks. But in the long run, over which inflation expectations adjust, there isn’t supposed to be a long-run Phillips curve tradeoff between growth and inflation. And over a long-term horizon, animal spirits would be expected to even out and long-term returns would reflect their long-term averages.
- Bond principal and interest must be paid out of national income. If there is a major shortfall in national income, bond defaults rise, governments have to raise taxes, or print money, and there is potential for stagflation in a supply shock scenario. Bonds don’t escape.
- Of course, nominal bond returns are capped, you will never get more than principal and interest. So the return profile is less volatile. And unfortunately, less correlated in the best scenario for stocks. So in a strong growth scenario, “di-worse-ification.” At current rates, bonds are not priced to provide any long-term real return, merely a hedge against deflation and a really bad outcome for stocks.
- You can’t make a large, long-term, positive expected real return bet that is negatively correlated with GDP or stocks. You can buy a long-term put from Warren Buffett, but it’s a negative return if the S&P goes nowhere, and if the S&P plunges to 666 so the option is in the money, you have to worry about even Warren Buffett’s ability to pay, and buy CDS to hedge your Berkshire Hathaway credit exposure. When it comes to GDP, we’re all in the same boat. (You could argue some people made such a bet against subprime mortgage CDOs in 2007. And they essentially broke the global financial system and put a lot of doubt on their ability to actually get paid on their bets. I would argue that e.g. gold is a zero long run real return asset that it makes sense to own a bit of, as an inflation/currency collapse hedge.)
- Since the 80s, real returns for bonds have had a modestly negative correlation with stocks, but over the long haul, bond returns have had a modestly positive correlation with stocks. Over the crisis, they had a hugely negative correlation and offered tremendous diversification. But that has more to do with the specific nature of this crisis, and is not true over all long-term outcomes.
- A cliché is that in a crisis, correlations go to one. Of course, this is just another way of saying, returns are not normally distributed. If they were, correlations would not go to one. We seem to have 100-year storms every 7 years. Because crises have abnormally large moves, the statement becomes a tautology. (Visualize a regime of tiny fluctuating random change, followed by a big move. It doesn’t matter how big the move is, it will make the correlation go toward one, because all the variance is in the last big move.)
- Long-term future outcomes aren’t a binomial distribution. More like a binary distribution, things might be very good or very bad. Prices may be a random walk in the short run in a specific market regime, but in the long run, there are major regime shifts, and it’s a series of ‘punctuated equilibria’, long periods of life in Mediocristan followed by violent bouts of Extremistan.
- Like the length of the coast of Britain, the value of correlation depends on the scale of time and size you’re looking at. In the long run, for institutional-size portfolios, everything is correlated, and the ‘fractal dimension’ of the return space is a very low number.
- If you have a good intuition for how correlation works, you will have a good feel for how your portfolio will behave and what you can do to make it behave better. And realistic expectations are what gives you confidence to invest and take risk. If you really find good shorts and uncorrelated bets, they are invaluable. But in the long run, the free lunch is only so big.
</small>
1 To simplify the formulas a little, this is using 1 share of each and dollar volatility.
The more commonly cited formula relating portfolio volatility as a percentage of assets to percentage volatility and weights of underlying assets is:
![]()
which we simplified by setting σA = wAσA and σB = wBσB